Lesson 2
Reasoning about Contexts with Tape Diagrams
2.1: Notice and Wonder: Remembering Tape Diagrams (5 minutes)
Warm-up
The purpose of this warm-up is to re-introduce students to these diagrams as a representation of relationships between quantities. As students use tape diagrams as a tool for reasoning, they understand that the length of a piece of the “tape” carries meaning. Two pieces drawn to be the same length are understood to represent the same value. These pieces can be labeled with values to clarify what is known about the diagram, so two pieces labeled with the same letter indicate that they have the same value, even if that value is not known. These diagrams will be helpful for reasoning about situations in activities in this lesson. When students choose to use a tape diagram to represent a relationship between values and reason about a problem, they are using appropriate tools strategically (MP5). Tasks like this one ensure that students understand how such a tool works so that they are more likely to choose to use it correctly and appropriately.
Launch
Arrange students in groups of 2. Tell students that they will look at an image, and their job is to think of at least one thing they notice and at least one thing they wonder. Display the image for all to see. Ask students to give a signal when they have noticed or wondered about something. Give students 1 minute of quiet think time, and then 1 minute to discuss the things they notice with their partner, followed by a whole-class discussion.
Give students 1 additional minute of quiet work time to complete the second question followed by a whole-class discussion.
Student Facing
- What do you notice? What do you wonder?
-
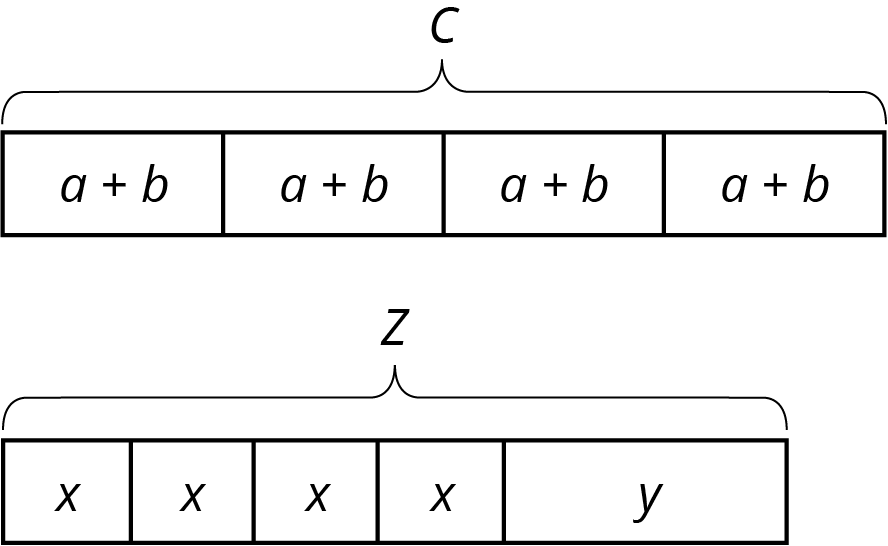
What are some possible values for \(a\), \(b\), and \(c\) in the first diagram?
For \(x\), \(y\), and \(z\) in the second diagram? How did you decide on those values?
Student Response
For access, consult one of our IM Certified Partners.
Activity Synthesis
Ask students to share the things they noticed and wondered. Record and display their responses for all to see. If possible, record the relevant reasoning on or near the image. After each response, ask the class whether they agree or disagree and to explain alternative ways of thinking, referring back to the images each time.
Ask students to share possible values for the variables in each diagram. Record and display their responses for all to see. If possible, record the values on the displayed diagram. If the idea that pieces labeled with the same variable represent the same value does not arise in the discussion, make that idea explicit. For example, students should assume that all the pieces labeled with \(y\) in one diagram have the same value. When they make tape diagrams, they know to draw rectangles of the same length to show the same value, but since quick diagrams are sometimes sloppy, it’s also important to label pieces with numbers or letters to show known and relative values.
2.2: Every Picture Tells a Story (15 minutes)
Activity
In this activity, students explain how a tape diagram represents a situation. They also use the tape diagram to reason about the value of the unknown quantity. Students are not expected to write and solve equations here; any method they can explain for finding values for \(x\) and \(y\) is acceptable. While some students might come up with equations to describe the diagram and solve for the unknown, there is no need to focus on developing those ideas at this time.
Launch
Arrange students in groups of 3. (Some groups of 2 are okay, if needed.)
Ask students if they know what a “flyer” is. If any students do not know, explain or ask a student to explain. If possible, reference some examples of flyers hanging in school.
Ensure students understand they should take turns speaking and listening, and that there are two things to do for each diagram: explain why it represents the story, and also figure out any unknown values in the story.
Supports accessibility for: Organization; Attention
Student Facing
Here are three stories with a diagram that represents it. With your group, decide who will go first. That person explains why the diagram represents the story. Work together to find any unknown amounts in the story. Then, switch roles for the second diagram and switch again for the third.
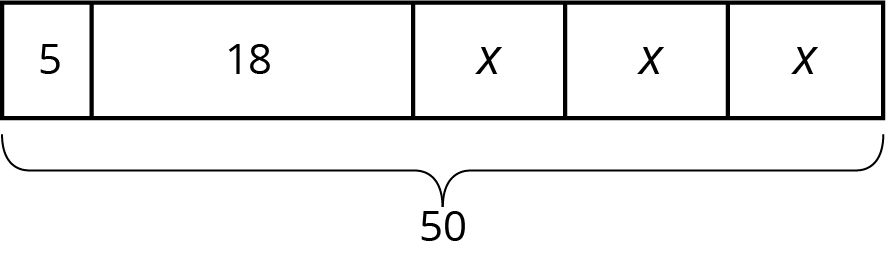
- Mai made 50 flyers for five volunteers in her club to hang up around school. She gave 5 flyers to the first volunteer, 18 flyers to the second volunteer, and divided the remaining flyers equally among the three remaining volunteers.
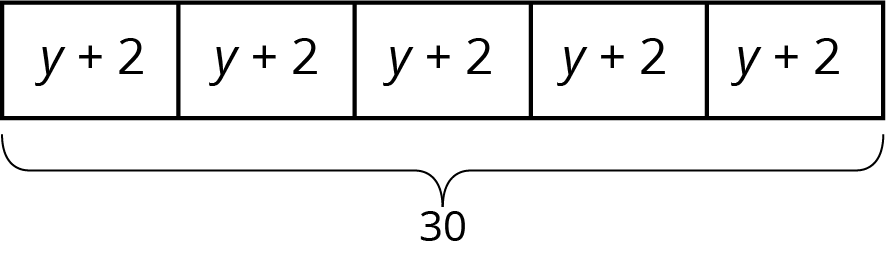
- To thank her five volunteers, Mai gave each of them the same number of stickers. Then she gave them each two more stickers. Altogether, she gave them a total of 30 stickers.
-
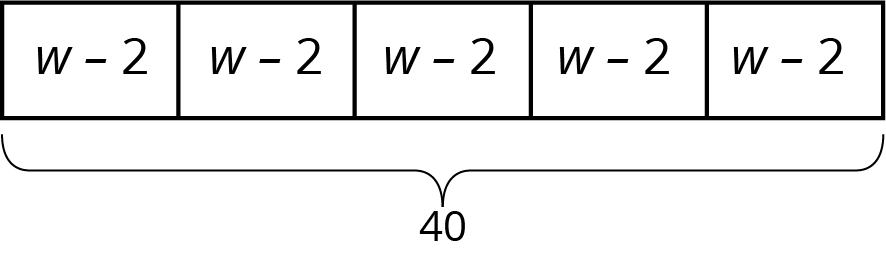
Mai distributed another group of flyers equally among the five volunteers. Then she remembered that she needed some flyers to give to teachers, so she took 2 flyers from each volunteer. Then, the volunteers had a total of 40 flyers to hang up.
Student Response
For access, consult one of our IM Certified Partners.
Anticipated Misconceptions
Students may not realize that when a variable is assigned to represent a quantity in a situation, it has the same value each time it appears. Revisit what \(x\) and \(y\) represent in these problems and why each occurrence of a variable must represent the same value.
In the second situation, students might argue that a more accurate representation would be 5 boxes with \(y\) to show the first distribution of stickers, and then five boxes with 2 to show the second distribution. Tell students that such a representation would indeed correctly describe the actions in the situation, but that the work of the task is to understand this diagram to set us up for success later.
Activity Synthesis
Tape diagrams represent relationships between quantities in stories. The goals here are to make sure students understand how parts of the diagram match the information about the story, and for them to begin to reason about how the diagrams connect to the operations that can help find unknown amounts.
Invite one group to provide an explanation for each diagram—both how the diagram represents the story, and how they reasoned about the unknown amounts. After each, ask the class if anyone thought about it a different way. (One additional line of reasoning for each diagram is probably sufficient.)
Here are some questions you might ask to encourage students to be more specific:
- “What question could you ask about the story?”
- “Where in the diagrams do you see equal parts? How do you know they are equal?”
- “What quantity does the variable represent in the story? How do you know?”
- “In the first story, where in the diagram do we see the ‘remaining flyers’?”
- “Why don’t we see the number 3 in the first diagram to show the 3 remaining volunteers?”
- “In the second diagram, where are the five volunteers represented?”
- “How did the diagrams help you find the value of the unknown quantities?”
Design Principle(s): Maximize meta-awareness
2.3: Every Story Needs a Picture (15 minutes)
Activity
In the previous activity, students interpreted given tape diagrams and explained how they represented a story. Here, they have a chance to draw tape diagrams to represent a story. The first story is a bit more scaffolded because it specifies what \(x\) represents. In the other two stories, students need to decide which quantity to represent with a variable and choose a letter to use. As with all activities in this lesson, students are not expected to write and solve an equation. This preliminary work supports the understanding needed to be able to represent such situations with equations.
Launch
Keep students in the same groups. You might have each student draw all three diagrams and compare them with their groups, working together to resolve any discrepancies. Or if time is short, you might assign each student in the group a different story—ask each student to explain their diagram to their group to see if their group members agree with their interpretation.
For classrooms using the digital version of the materials, take a minute to demonstrate how the controls work in the applet. Some students may prefer to draw the diagrams in their notebooks or on scratch paper.
Supports accessibility for: Language; Organization
Student Facing
Here are three more stories. Draw a tape diagram to represent each story. Then describe how you would find any unknown amounts in the stories.
- Noah and his sister are making gift bags for a birthday party. Noah puts 3 pencil erasers in each bag. His sister puts \(x\) stickers in each bag. After filling 4 bags, they have used a total of 44 items.
- Noah’s family also wants to blow up a total of 60 balloons for the party. Yesterday they blew up 24 balloons. Today they want to split the remaining balloons equally between four family members.
- Noah’s family bought some fruit bars to put in the gift bags. They bought one box each of four flavors: apple, strawberry, blueberry, and peach. The boxes all had the same number of bars. Noah wanted to taste the flavors and ate one bar from each box. There were 28 bars left for the gift bags.
Student Response
For access, consult one of our IM Certified Partners.
Student Facing
Are you ready for more?
Design a tiling that uses a repeating pattern consisting of 2 kinds of shapes (e.g., 1 hexagon with 3 triangles forming a triangle). How many times did you repeat the pattern in your picture? How many individual shapes did you use?
Student Response
For access, consult one of our IM Certified Partners.
Activity Synthesis
Much of the discussion will take place in groups. Here are some ideas for synthesizing students’ learning about creating tape diagrams:
- Ask students if they had any disagreements in their groups and how they resolved them.
- Ask students how they decided which unknown quantity to find in the story. The first story specifies \(x\) stickers, but the other stories do not define a variable.
- Display one diagram for each story and ask students to explain how they are alike and how they are different.
Lesson Synthesis
Lesson Synthesis
Display one or more of the tape diagrams students encountered or created during the lesson. Ask, “What are some ways that tape diagrams give information about a story?” Responses to highlight:
- A total amount is indicated.
- Pieces that represent equal amounts are the same length (or roughly the same length, if sketching by hand).
- Pieces that represent different amounts are not the same length.
- Pieces are labeled with either their amounts, a variable representing an unknown amount, or an expression like \(x+1\) to mean “1 more than the unknown amount.”
2.4: Cool-down - Red and Yellow Apples (5 minutes)
Cool-Down
For access, consult one of our IM Certified Partners.
Student Lesson Summary
Student Facing
Tape diagrams are useful for representing how quantities are related and can help us answer questions about a situation.
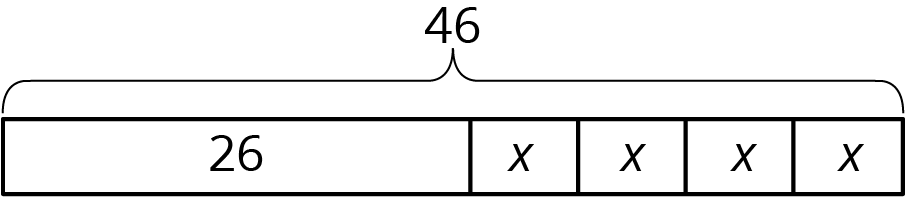
Suppose a school receives 46 copies of a popular book. The library takes 26 copies and the remainder are split evenly among 4 teachers. How many books does each teacher receive? This situation involves 4 equal parts and one other part. We can represent the situation with a rectangle labeled 26 (books given to the library) along with 4 equal-sized parts (books split among 4 teachers). We label the total, 46, to show how many the rectangle represents in all. We use a letter to show the unknown amount, which represents the number of books each teacher receives. Using the same letter, \(x\), means that the same number is represented four times.
Some situations have parts that are all equal, but each part has been increased from an original amount:
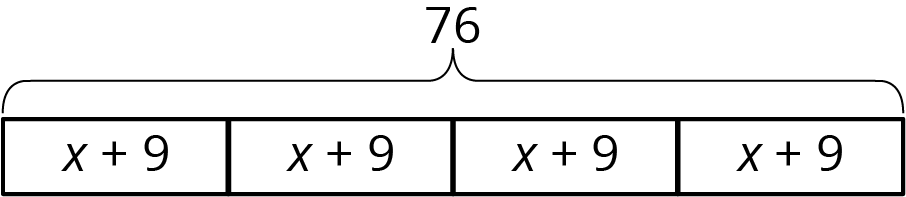
A company manufactures a special type of sensor, and packs them in boxes of 4 for shipment. Then a new design increases the weight of each sensor by 9 grams. The new package of 4 sensors weighs 76 grams. How much did each sensor weigh originally?
We can describe this situation with a rectangle representing a total of 76 split into 4 equal parts. Each part shows that the new weight, \(x+9\), is 9 more than the original weight, \(x\).