Lesson 1
Describing and Graphing Situations
Problem 1
The relationship between the amount of time a car is parked, in hours, and the cost of parking, in dollars, can be described with a function.
- Identify the independent variable and the dependent variable in this function.
- Describe the function with a sentence of the form "\(\underline{\hspace{0.5in}}\) is a function of \(\underline{\hspace{0.5in}}\)."
-
Suppose it costs $3 per hour to park, with a maximum cost of $12.
Sketch a possible graph of the function. Be sure to label the axes.
- Identify one point on the graph and explain its meaning in this situation.
Solution
For access, consult one of our IM Certified Partners.
Problem 2
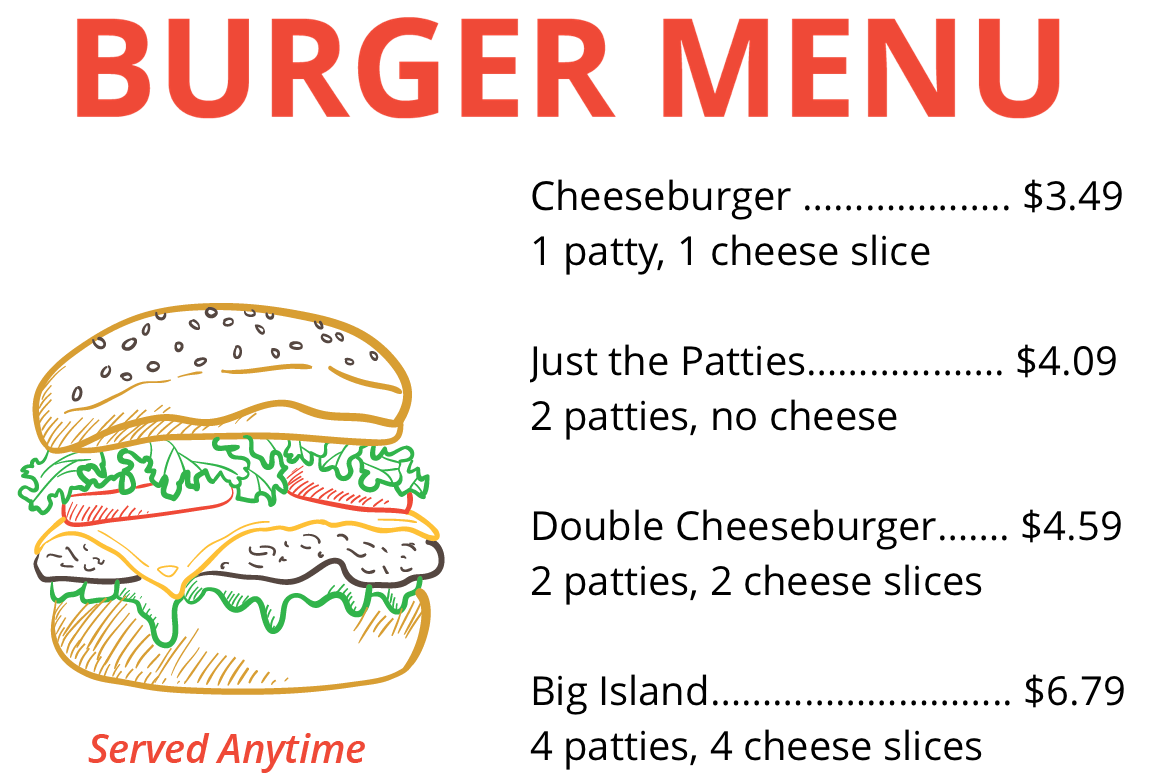
The prices of different burgers are shown on this sign.
Based on the information from the menu, is the price of a burger a function of the number of patties? Explain your reasoning.

Solution
For access, consult one of our IM Certified Partners.
Problem 3
The distance a person walks, \(d\), in kilometers, is a function of time, \(t\), in minutes, since the walk begins.
Select all true statements about the input variable of this function.
Distance is the input.
Time of day is the input.
Time since the person starts walking is the input.
\(t\) represents the input.
\(d\) represents the input.
The input is not measured in any particular unit.
The input is measured in hours.
For each input, there are sometimes two outputs.
Solution
For access, consult one of our IM Certified Partners.
Problem 4
It costs $3 per hour to park in a parking lot, with a maximum cost of $12.
Explain why the amount of time a car is parked is not a function of the parking cost.
Solution
For access, consult one of our IM Certified Partners.
Problem 5
Here are clues for a puzzle involving two numbers.
- Seven times the first number plus six times the second number equals 31.
- Three times the first number minus ten times the second number is 29.
What are the two numbers? Explain or show your reasoning.
Solution
For access, consult one of our IM Certified Partners.
(From Unit 2, Lesson 12.)Problem 6
To keep some privacy about the students, a professor releases only summary statistics about student scores on a difficult quiz.
| mean | standard deviation | minimum | Q1 | median | Q3 | maximum |
|---|---|---|---|---|---|---|
| 66.91 | 12.74 | 12 | 57 | 66 | 76 | 100 |
Based on this information, what can you know about outliers in the student scores?
There is an outlier at the upper end of the data.
There is an outlier at the lower end of the data.
There are outliers on both ends of the data.
There is not enough information to determine whether there are any outliers.
Solution
For access, consult one of our IM Certified Partners.
(From Unit 1, Lesson 14.)Problem 7
An airline company creates a scatter plot showing the relationship between the number of flights an airport offers and the average distance in miles travelers must drive to reach the airport. The correlation coefficient of the line of best fit is -0.52.
- Are they correlated? Explain your reasoning.
- Do either of the variables cause the other to change? Explain your reasoning.
Solution
For access, consult one of our IM Certified Partners.
(From Unit 3, Lesson 9.)