Lesson 1
Describing and Graphing Situations
1.1: Bagel Shop (15 minutes)
Warm-up
The goal of this opening activity is to activate, through a familiar context, what students know about functions from middle school.
Students first encounter a relationship in which two quantities—the number of bagels bought and price—do not form a function. They see that for some numbers of bagels bought, there are multiple possible prices. The relationship between the number of bagels bought and the best price, however, do form a function, because there is only one possible best price for each number of bagels.
Students contrast the two relationships by reasoning about possible prices, completing a table of values, and observing the graphs of the relationships.
Launch
Arrange students in groups of 4. Give students a few minutes of quiet time to think about the first question, and then a couple of minutes to share their thinking with their group. Pause for a class discussion.
Invite students to share an explanation as to how each person in the situation could be right. If possible, record and display students’ reasoning for all to see. After the reasoning behind each price is shared, direct students to the table in the second question. Ask students to write down “best price” in the header of the second column and then complete the table.
Student Facing
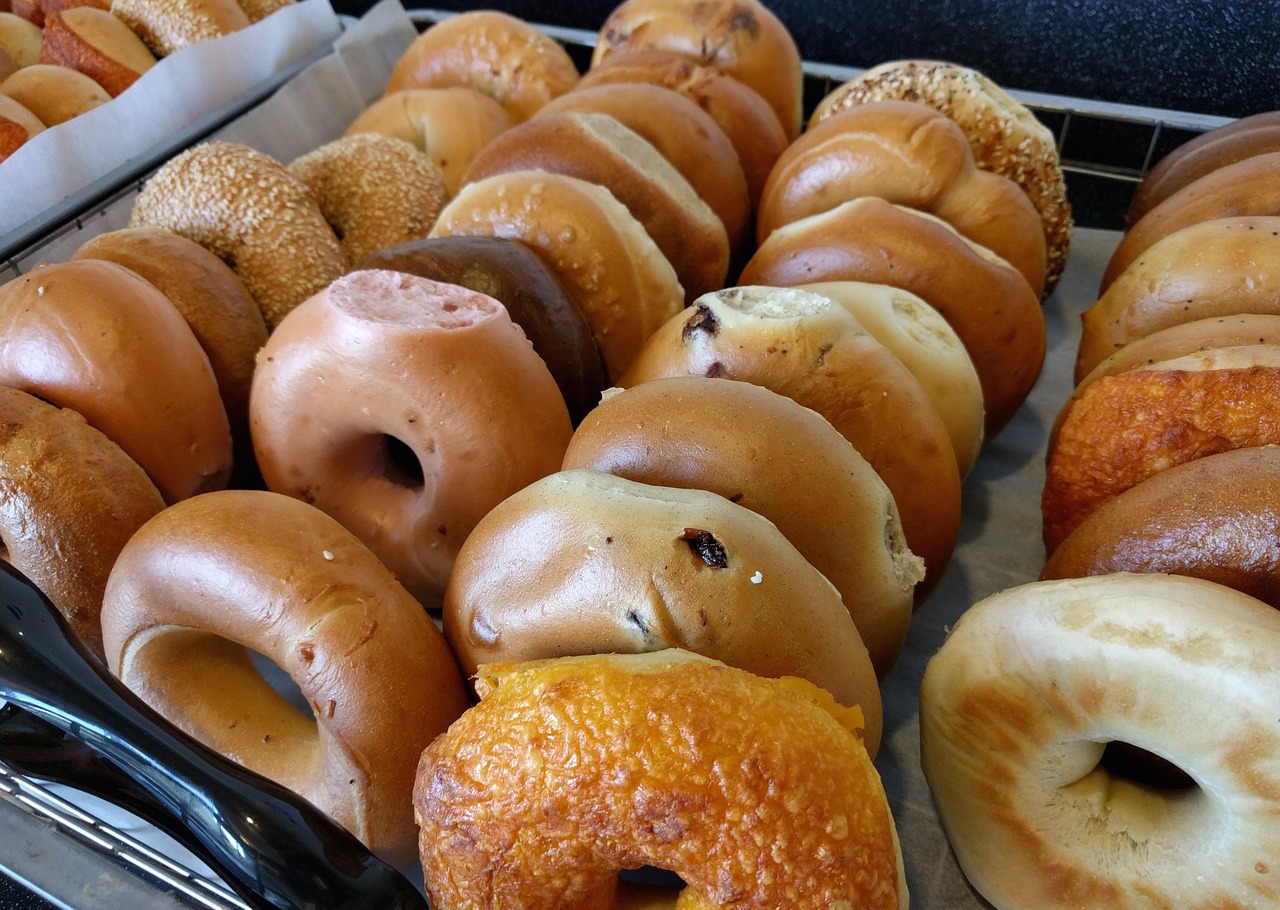
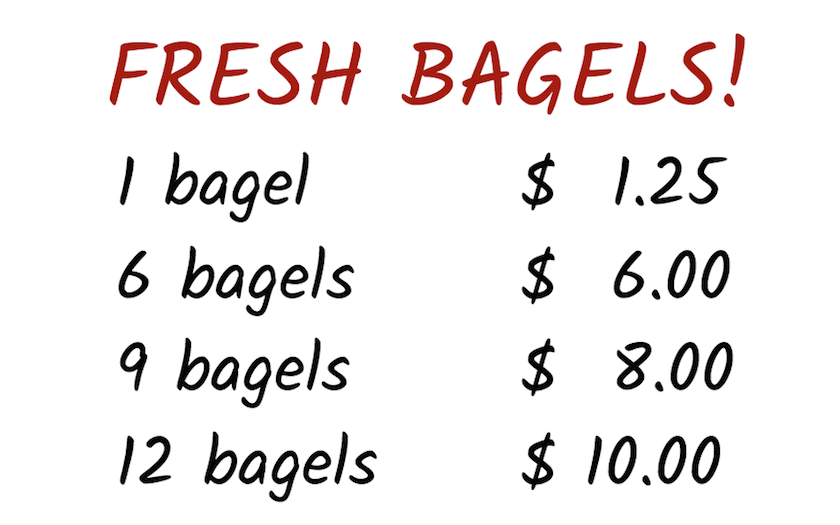
A customer at a bagel shop is buying 13 bagels. The shopkeeper says, “That would be $16.25.”
Jada, Priya, and Han, who are in the shop, all think it is a mistake.
- Jada says to her friends, “Shouldn’t the total be \$13.25?”
- Priya says, “I think it should be \$13.00.”
- Han says, “No, I think it should be \$11.25.”
Explain how the shopkeeper, Jada, Priya, and Han could all be right.
Your teacher will give you instructions for completing the table.
| number of bagels |
|
|---|---|
| 1 | |
| 2 | |
| 3 | |
| 4 | |
| 5 | |
| 6 | |
| 7 | |
| 8 | |
| 9 | |
| 10 | |
| 11 | |
| 12 | |
| 13 |
Student Response
For access, consult one of our IM Certified Partners.
Activity Synthesis
Consider displaying a table to summarize the different possibilities for calculating the price of 13 bagels (or the prices for 6 or more bagels), as well as the table showing the best price for each number of bagels bought.
| number of bagels |
shopkeeper’s price |
Jada’s price |
Priya’s price |
Han’s price |
|---|---|---|---|---|
| 1 | 1.25 | |||
| 2 | 2.50 | |||
| 3 | 3.75 | |||
| 4 | 5.00 | |||
| 5 | 6.25 | |||
| 6 | 7.50 | 6.00 | ||
| 7 | 8.75 | 7.25 | ||
| 8 | 10.00 | 8.50 | ||
| 9 | 11.25 | 9.75 | 8.00 | |
| 10 | 12.50 | 11.00 | 9.25 | |
| 11 | 13.75 | 12.25 | 10.50 | |
| 12 | 15.00 | 12.00 | 11.75 | 10.00 |
| 13 | 16.25 | 13.25 | 13.00 | 11.25 |
| number of bagels |
best price |
|---|---|
| 1 | 1.25 |
| 2 | 2.50 |
| 3 | 3.75 |
| 4 | 5.00 |
| 5 | 6.25 |
| 6 | 6.00 |
| 7 | 7.25 |
| 8 | 8.50 |
| 9 | 8.00 |
| 10 | 9.25 |
| 11 | 10.50 |
| 12 | 10.00 |
| 13 | 11.25 |
Ask students,
- “’Number of bagels’ and ’price’ do not form a function, but ’number of bagels’ and ’best price’ do form a function. Why is this? What do you recall about functions?”
- “If we graph the relationship between ’number of bagels’ and ’price,’ what do you think the graph would look like?”
- “If we graph the relationship between ’number of bagels’ and ’best price,’ what would the graph look like?”
After students make some predictions, display the two graphs for all to see. In the first graph, solid blue dots represent the shopkeeper’s price, open green circles Jada’s price, red squares Priya’s price, and yellow triangles Han’s price. In the second graph, each X represents the best price for each number of bagel.


Emphasize that a function assigns one output to each input. Clarify that the word “function” in mathematics has a very specific meaning that does not necessarily agree with how “function” is used in everyday life (for instance, as in the sentence “The function of a bridge is to connect two sides of a river.”).
1.2: Be Right Back! (10 minutes)
Activity
This activity further refreshes students’ understanding of functions through contextual examples. Here students are prompted to reason graphically about the relationship between the two quantities in the situation—time in seconds and the distance of a dog from a post. Students also recall the meaning of independent and dependent variables.
Students are given descriptions of the dog’s movement while it was attached to a post, and asked to sketch corresponding graphs. Along the way, students interpret each point on the graph to mean a particular point in time and a particular distance from the post.
Students later reason that the relationship between time and distance is a function because the dog can only be in one location at any time. For instance, the dog could not be both 5 feet and 1.7 feet away from the post at the same exact time.
As students work, notice if any students create a graph with a vertical value greater than 5, or a graph that does not go through the two given points. If many graphs show these features, discuss with the class why the former is not possible and why the latter does not match the given descriptions.
Launch
Read the task statement and the descriptions about the dog owner and his three days of dog walking.
Discuss features of a graph that could represent the dog’s movement on Day 3 and display a possible graph. An example is shown here.

Keep students in groups of 4. Ask 2 group members to graph the dog’s movement on Day 1, and the other 2 members to graph the movement on Day 2.
Design Principle: Support sense-making
Supports accessibility for: Conceptual processing; Visual-spatial processing
Student Facing
Three days in a row, a dog owner tied his dog’s 5-foot-long leash to a post outside a store while he ran into the store to get a drink. Each time, the owner returned within minutes.
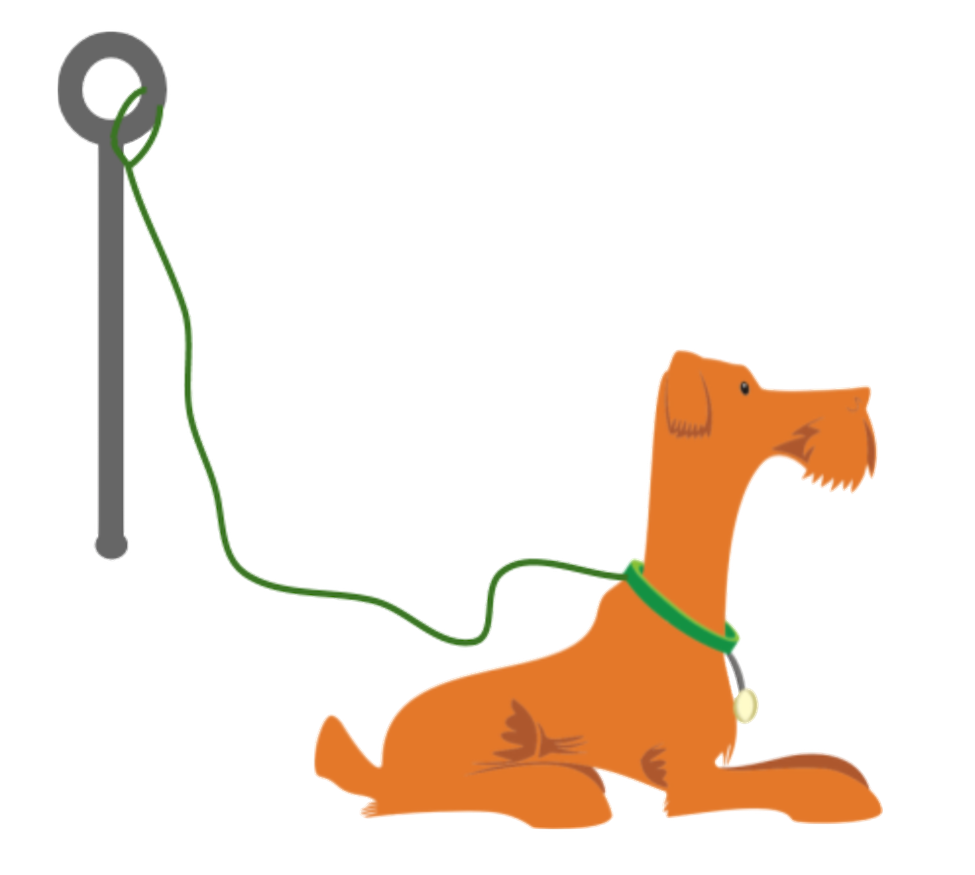
The dog’s movement each day is described here.
- Day 1: The dog walked around the entire time while waiting for its owner.
- Day 2: The dog walked around for the first minute, and then laid down until its owner returned.
- Day 3: The dog tried to follow its owner into the store but was stopped by the leash. Then, it started walking around the post in one direction. It kept walking until its leash was completely wound up around the post. The dog stayed there until its owner returned.
- Each day, the dog was 1.5 feet away from the post when the owner left.
- Each day, 60 seconds after the owner left, the dog was 4 feet from the post.
Your teacher will assign one of the days for you to analyze.
Sketch a graph that could represent the dog’s distance from the post, in feet, as a function of time, in seconds, since the owner left.
Day \(\underline{\hspace{0.5in}}\)

Student Response
For access, consult one of our IM Certified Partners.
Student Facing
Are you ready for more?
From the graph, is it possible to tell how many times the dog changed directions while walking around? Explain your reasoning.
Student Response
For access, consult one of our IM Certified Partners.
Activity Synthesis
Select some students to share their graphs and a brief explanation of how the graphs match the descriptions.
One takeaway from this activity is that the relationship between the time since the owner left and the dog’s distance from the post is a function. Solicit as many explanations as possible as to why it is. To emphasize that a function is a relationship in which one output is assigned to every input, explain that:
- The dog can only be in one spot at a time and cannot have more than one distance away from the post at any time.
- On each graph, we can see that only one value for distance corresponds to each value for time.
Ask students,
- “In this situation, what is the input and what is the output?” (It makes sense for time in seconds to be the input and distance from the post to be the output.)
- “Is it possible for the distance to be the input and the time to be the output? Why or why not?” (It is possible, but if the distance is the input, the relationship is no longer a function. This is because there could be multiple possible times at which the dog is a certain distance away from the post.)
Remind students that a quantity that is an input for a function is called an independent variable, and a quantity that is an output is called a dependent variable. In this case, time is independent and distance from the post is dependent.
1.3: Talk about a Function (10 minutes)
Activity
This activity gives students a chance to use mathematical language to describe relationships that are functions, and to practice sketching a graph of a function given a description. The context is the same as in the previous activity, but the quantities are different.
Deciding on which variable is independent and which is dependent, as well as sketching a graph of the relationship, engages students in aspects of modeling (MP4). They require students to make sense of quantities, consider how they are related, and think about what values are reasonable. Using the language of function to articulate the relationship between variables is an opportunity to attend to precision (MP6).
When sketching a graph for the function that defines the number of barks, students are likely to create either a discrete graph or a continuous graph. (Because the total number of barks cannot be fractional, creating a step graph would most accurately represent it as a function of time, but students are not expected to do so at this point.) Identify students who sketch each kind of graph. If time permits, select them to share their thinking during class discussion.
Launch
Arrange students in groups of 2. Tell students their task is to analyze two pairs of quantities from a familiar situation. Ask partners to each choose a different pair of quantities. Give students a few minutes of quiet work time, and then time for partners to take turns sharing their functions and representations.
Tell students that the partner who is listening should listen for the following information:
- How did their partner decide which quantity is independent (the input) and which is dependent (the output)?
- How did they decide what makes \(\underline{\hspace{0.5in}}\) a function of \(\underline{\hspace{0.5in}}\)?
- How does the graph represent the relationship between \(\underline{\hspace{0.5in}}\) and \(\underline{\hspace{0.5in}}\)?
- On the graph, how was the scale for each axis determined?
Encourage students to notice any part of their own or their partner’s statement or graph that may not seem reasonable in the situation, and then think about what might be more reasonable. (For instance, it is not reasonable for a dog to bark 1,000 times in 2 minutes.)
Leave 1–2 minutes for a whole-class discussion.
Design Principle(s): Support sense-making
Supports accessibility for: Language; Organization
Student Facing
Here are two pairs of quantities from a situation you’ve seen in this lesson. Each pair has a relationship that can be defined as a function.
- time, in seconds, since the dog owner left and the total number of times the dog has barked
- time, in seconds, since the owner left and the total distance, in feet, that the dog has walked while waiting
Choose one pair of quantities and express their relationship as a function.
- In that function, which variable is independent? Which one is dependent?
- Write a sentence of the form “\(\underline{\hspace{0.5in}}\) is a function of \(\underline{\hspace{0.5in}}\).”
-
Sketch a possible graph of the relationship on the coordinate plane. Be sure to label and indicate a scale on each axis, and be prepared to explain your reasoning.

Student Response
For access, consult one of our IM Certified Partners.
Anticipated Misconceptions
Because we often identify the input of a function first, some students may think that the independent variable always goes first in the statement “\(\underline{\hspace{0.5in}}\) is a function of \(\underline{\hspace{0.5in}}\).”
Explain that we can think of the phrase “is a function of” to mean “depends on.“ Suggest that they use “depends on” to describe the relationship between the quantities both ways and see which one makes more sense. For example, “The dog’s distance from the post depends on the time since the owner left,“ or “the time since the owner left depends on the dog’s distance from the post.“ The former makes more sense, so we can say, “The dog’s distance from the post is a function of time since the owner left.”
Activity Synthesis
For each situation, select 1–2 students who drew different graphs to display them for all to see. Ask the students to briefly explain how they decided which quantity should be the input and which should be the output, as well as what the graph should look like.
Lesson Synthesis
Lesson Synthesis
Refer back to the situations in the last two activities. Discuss with students why, for each relationship to be a function, it makes sense for time to be the independent variable and the other quantity to be the dependent variable. Ask students,
- “In the situation that involved time and number of barks, suppose the number of barks is the input and the time is the output. Is it possible that when the number of barks is 6, both 15 seconds and 16 seconds have passed?” (Yes)
- “Can the time be a function of number of barks? Why or why not?” (No, because for any number of barks, more than one possible time could be the output.)
- “In the situation that involved time and the total distance walked by the dog, suppose the distance is the input and the time is the output. Is it possible that when the dog has walked 27 feet, 50 seconds, 55 seconds, and 60 seconds have passed?” (Yes)
- “Can the time be a function of the total distance walked? Why or why not?” (No, because for any number of feet walked, many possible numbers of seconds could have passed.)
If time permits, ask students to think of another example of a possible function in that situation (the number of times the dog was petted by a passerby as a function of time, for example), and to identify the input and output variables.
1.4: Cool-down - The Backyard Pool (5 minutes)
Cool-Down
For access, consult one of our IM Certified Partners.
Student Lesson Summary
Student Facing
A relationship between two quantities is a function if there is exactly one output for each input. We call the input the independent variable and the output the dependent variable.
Let’s look at the relationship between the amount of time since a plane takes off, in seconds, and the plane’s height above the ground, in feet.
-
These two quantities form a function if time is the independent variable (the input) and height is the dependent variable (the output). This is because at any amount of time since takeoff, the plane could only be at one height above the ground.
For example, 50 seconds after takeoff, the plane might have a height of 180 feet. At that moment, it cannot be simultaneously 180 feet and 95 feet above the ground.
For any input, there is only one possible output, so the height of the plane is a function of the time since takeoff.
-
The two quantities do not form a function, however, if we consider height as the input and time as the output. This is because the plane can be at the same height for multiple lengths of times since takeoff.
For instance, when the plane is 1,500 feet above ground, it is possible that 300 seconds have passed. It is also possible that 425 seconds, 275 seconds, or some other amounts of time have passed.
For any input, there are multiple possible outputs, so the time since takeoff is not a function of the height of the plane.
Functions can be represented in many ways—with a verbal description, a table of values, a graph, an expression or an equation, or a set of ordered pairs.
When a function is represented with a graph, each point on the graph is a specific pair of input and output.
Here is a graph that shows the height of a plane as a function of time since takeoff.

The point \((125, 400)\) tells us that 125 seconds after takeoff, the height of the plane is 400 feet.