Lesson 5
Using Function Notation to Describe Rules (Part 2)
5.1: Make It True (5 minutes)
Warm-up
This warm-up refreshes the idea of evaluating and solving equations, preparing students for the main work of the lesson. It reminds students that to solve a variable equation is to find one or more values for the variable that would make the equation true. In subsequent activities, students will work with equations in function notation to find unknown input or output values.
Student Facing
Consider the equation \(q = 4 + 0.8p\).
-
What value of \(q\) would make the equation true when:
- \(p\) is 7?
- \(p\) is 100?
-
What value of \(p\) would make the equation true when:
- \(q\) is 12?
- \(q\) is 60?
Be prepared to explain or show your reasoning.
Student Response
For access, consult one of our IM Certified Partners.
Activity Synthesis
Invite students to share their response and strategy for answering the questions.
To find the values of \(p\) in the second set of questions, some students may have guessed and checked, but many students should have recognized that they could solve the equations for \(p\) (either before or after substituting the value of \(q\)). If no students mentioned solving the equations, bring it to their attention.
Remind students that to solve \(12=4+0.8p\) is to find the value of \(p\) that makes the equation true.
5.2: Data Plans (25 minutes)
Activity
In this activity, students work with rules of functions that arise from situations and continue to make connections between different representations of functions. They use rules to evaluate functions and interpret the input and output values in context. For instance, they see that \(B(1)\) represents the cost of using 1 gigabyte of data beyond the monthly allowance of Data Plan B, and find its value by computing \(10(1)+25\).
Students also use rules of functions to solve for an unknown input value. For example, given the rule \(B(x) = 10x + 25\) and the statement \(B(x)=50\), they work to find a value of \(x\) that makes \(B(x) = 50\) true. They do so by:
- guessing and checking
- analyzing the graph of \(y=10x+25\) and identifying the \(x\)-value when \(y\) is 50
- reasoning that a budget of \$50 means that only \$25 is available for extra data, and at \$10 per gigabyte, it means 2.5 gigabytes of data
- solving \(10x+25=50\) algebraically
Identify students who use different strategies and ask them to share their thinking later.
Launch
Arrange students in groups of 2.
As a class, read the opening paragraphs and the first question in the activity statement. Ask students, “What do \(A(1)\) and \(B(1)\) represent in this situation? What does the 1 in each expression mean?” Give students a minute of quiet think time and then time to discuss their thinking with their partner.
Invite students to share their interpretations, in particular the meaning of “allowance.” Most data plans include a basic amount of data at a fixed cost but start charging an additional fee if usage goes beyond this allowance. Before students begin the activity, make sure they see that an input value of 1 represents usage of 1 gigabyte of data beyond the monthly allowance.
Design Principle(s): Optimize output; Cultivate conversation
Student Facing
A college student is choosing between two data plans for her new cell phone. Both plans include an allowance of 2 gigabytes of data per month. The monthly cost of each option can be seen as a function and represented with an equation:
- Option A: \(A(x) = 60\)
- Option B: \(B(x) = 10x + 25\)
In each function, the input, \(x\), represents the gigabytes of data used over the monthly allowance.
- The student decides to find the values of \(A(1)\) and \(B(1)\) and compare them. What are those values?
- After looking at some of her past phone bills, she decided to compare \(A(7.5)\) and \(B(7.5)\). What are those values?
- Describe each data plan in words.
- Graph each function on the same coordinate plane. Then, explain which plan you think she should choose.

- The student only budgeted \$50 a month for her cell phone. She thought, “I wonder how many gigabytes of data I would have for \$50 if I go with Option B?” and wrote \(B(x) = 50\). What is the answer to her question? Explain or show how you know.
Student Response
For access, consult one of our IM Certified Partners.
Student Facing
Are you ready for more?
Describe a different data plan that, for any amount of data used, would cost no more than one of the given plans and no less than the other given plan. Explain or show how you know this data plan would meet these requirements.
Student Response
For access, consult one of our IM Certified Partners.
Anticipated Misconceptions
Students may question if \(A\) is a function at all, because unlike \(B\) or other function rules they have seen so far, \(A(x)\) is defined with a constant instead of an expression containing the dependent variable. Or they may wonder why \(A(x)\) has the same value no matter what the input value is. Ask students to recall the definition of function and to consider whether each input value gives only one output value. Because it does, even though it is always the same output value, \(A\) is still a function.
Activity Synthesis
Select students to share their interpretations of the two data plans. Make sure students see that:
- The equation \(A(x)=60\) tells us that, regardless of the extra gigabytes of data used, \(x\), the cost, \(A(x)\) is always 60.
- The \(10x\) in the rule of \(B(x)\) tells us that each extra gigabyte of data used costs \$10, and that there is a \$25 fixed fee.
Explain to students that the two functions here are linear functions because the output of each function changes at a constant rate relative to the input. Option B involves a rate of change of \$10 per gigabyte of data over the monthly allowance, while Option A has a rate of change of \$0 per gigabyte over the allowance.
Then, ask students how they went about graphing the functions. Students are likely to have plotted some input-output pairs of each function. If no students mention identifying the slope and vertical intercept of each graph, ask them about it.
Next, focus the discussion on students’ response to the last question and how they found out the gigabytes of data that could be bought with \$50 under Option B. Select previously identified students to share their strategies, in the order listed in the Activity Narrative. If no one mentions solving using a graph or solving \(10x+25=50\), bring these up.
Explain the following points to help students connect some key ideas:
-
We can graph functions like \(A(x) = 60\) and \(B(x)=10x+25\) without plotting individual coordinate pairs.
-
\(A(x)\) is the output of function \(A\) and is represented by vertical values on a coordinate plane. The vertical values are typically labeled with the variable \(y\), so we can write \(y=A(x)\) and graph \(y=60\) to represent function \(A\).
-
Likewise, \(B(x)\) is the output of function \(B\) and is represented by vertical values on a plane. We can write \(y=B(x)\) and graph \(y=10x+25\) to represent function \(B\).
-
-
To solve equations like \(B(x) = 50\) means to find one or more values of \(x\) that make the equation true. We can do this, among other ways, by using the graph of \(B\) and by solving an equation algebraically.
-
On the graph of \(B\), we can look for one or more values of \(x\) that correspond to the vertical value of 50. This might involve some estimating.
-
Because \(B(x)\) is equal to \(10x + 25\) and \(B(x)\) is also equal to 50, we can write \(10x+25=50\) and solve the equation.
-
If time permits, invite students to share which option they believe the college student should choose and why.
Supports accessibility for: Visual-spatial processing; Conceptual processing
5.3: Function Notation and Graphing Technology (20 minutes)
Optional activity
In this optional activity, students learn to use graphing technology to graph an equation in function notation, evaluate the function at a specific input value, create a table of inputs and outputs, and identify the coordinates of the points along a graph. They also revisit how to set an appropriate graphing window.
Launch
Display the equation \(B(x) = 10x+25\) for all to see.
Ask students,
- “How would you go about finding the value of \(B(1.482)\)?” (Substitute 1.482 into the expression \(10x+25\) and evaluate, or use the graph of \(y=10x+25\) to estimate the \(y\)-value when \(x\) is 1.482.)
- “How would you find the value of \(x\) that makes \(B(x) = 103.75\) true? Try solving the equation.” (Solve \(10x+25=103.75\), or use the graph of \(y=10x+25\) to estimate the \(x\)-value when \(y\) is 103.75.)
Explain that while it’s possible to use a graph to find or estimate unknown input or output values, it is hard to be precise when using a hand-drawn or printed graph. We can evaluate the expression or solve the equation algebraically, but computing by hand can get cumbersome (though a calculator can take care of the most laborious part). Let’s see how graphing technology can help us!
Run Desmos and display for all to see. Point out the column on the left, which shows blank rows. We can use them to enter expressions and create a list. Demonstrate the following:
- In the first row of the expression list, type: \(B(x) = 10x+25\). A graph appears, but the line might appear to be squeezed up against the vertical axis.
- Click the “Graph Settings” button (wrench icon) in the upper right corner to change the graphing window. Experiment with the graphing window until the graph shows more information or seems more useful.
-
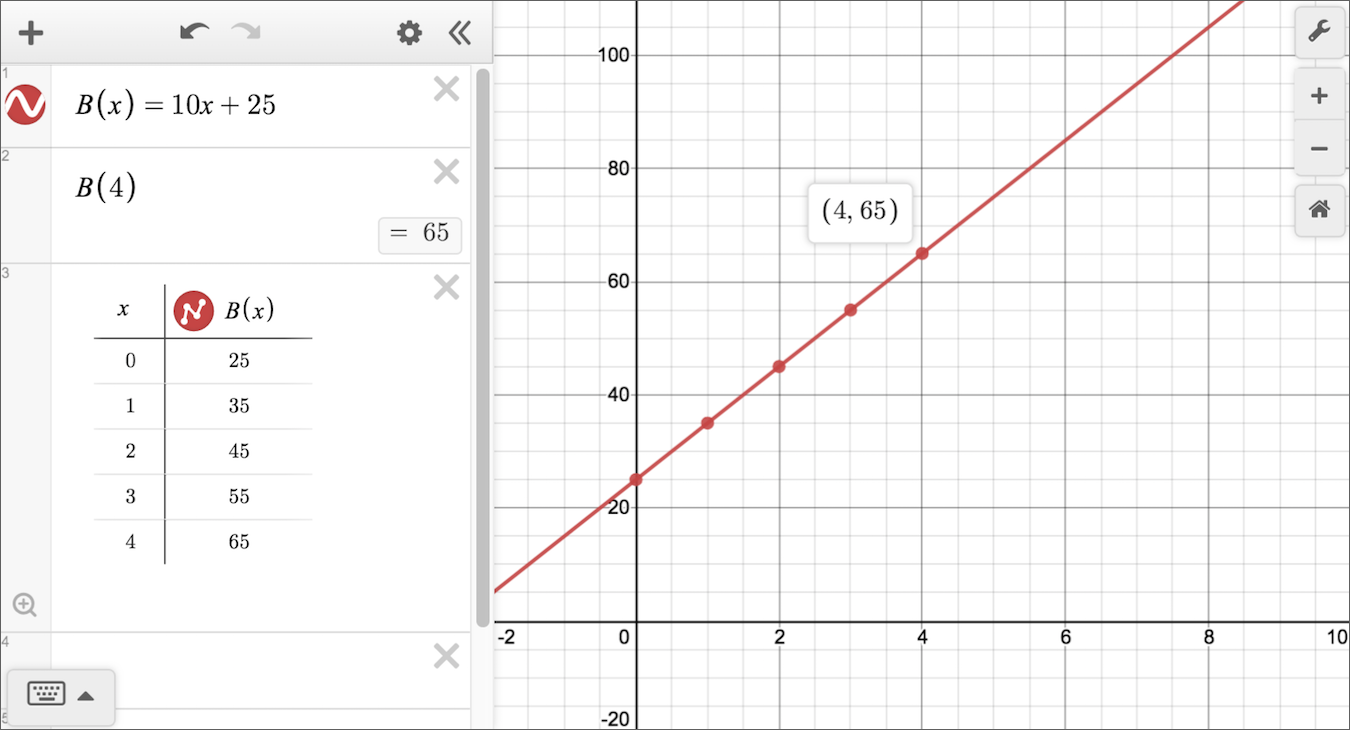
Ask students to find \(B(4)\) on the graph. Then, demonstrate some ways (other than approximating visually) to find \(B(4)\) more precisely:
- Trace the line. Coordinates appear as we move along the line.
- Type \(B(4)\) in the expression list. A small rectangle appears showing the value.
- Choose the list item that shows \(B(x) = 10x+25\). Click “Edit List” button (wheel icon) and then the table icon to create a table with \(x\) as the input and \(B(x)\) as the output. If we enter 4 in a cell for \(x\), the value of \(B(x)\) is calculated automatically.
Here is a screenshot showing these features.
-
Ask students to find the value of \(x\) when \(B(x)\) is 100. Then, demonstrate some ways (other than approximating visually) to solve for \(x\) given \(B(x) = 100\):
- Trace the line. Coordinates appear as we move along the line. Stop when the \(y\)-coordinate is 100 and see what the \(x\)-coordinate is.
- Type \(y=100\) in the expression list. A horizontal line appears. Find the intersection of this line and the graph of \(B\).
Ask students to use one or both of these strategies to compete the activity.
Supports accessibility for: Organization; Memory; Attention
Student Facing
The function \(B\) is defined by the equation \(B(x) = 10x + 25\). Use graphing technology to:
-
Find the value of each expression:
\(B(6)\)
\(B(2.75)\)
\(B(1.482)\)
-
Solve each equation:
\(B(x) = 93\)
\(B(x) = 42.1\)
\(B(x) = 116.25\)
Student Response
For access, consult one of our IM Certified Partners.
Launch
Display the equation \(B(x) = 10x+25\) for all to see. Ask students,
- “How would you go about finding the value of \(B(1.482)\)?” (Substitute 1.482 into the expression \(10x+25\) and evaluate, or use the graph of \(y=10x+25\) to estimate the \(y\)-value when \(x\) is 1.482.)
- “How would you find the value of \(x\) that makes \(B(x) = 103.75\) true? Try solving the equation.” (Solve \(10x+25=103.75\), or use the graph of \(y=10x+25\) to estimate the \(x\)-value when \(y\) is 103.75.)
Explain that while it’s possible to use a graph to find or estimate unknown input or output values, it is hard to be precise when using a hand-drawn or printed graph. We can evaluate the expression or solve the equation algebraically, but computing by hand can get cumbersome (though a calculator can take care of the most laborious part). Let’s see how graphing technology can help us!
The digital version of this activity includes instructions for using the Desmos Math Tool to graph an equation, change the graphing window, and find the output of a function for a given input. If students will be using different graphing technology, consider preparing alternate instructions.
- Demonstrate how to graph \(B(x) = 10x+25\), change the graphing window, and find \(B(4)\) on the graph.
-
Ask students to find the value of \(x\) when \(B(x)\) is 100. Then, demonstrate some ways (other than approximating visually) to solve for \(x\) given \(B(x) = 100\):
- Trace the line. Coordinates appear as we move along the line. Stop when the \(y\)-coordinate is 100 and see what the \(x\)-coordinate is.
- Type \(y=100\) in the expression list. A horizontal line appears. Find the intersection of this line and the graph of \(B\).
Ask students to use one or both of these strategies to complete the activity.
Supports accessibility for: Organization; Memory; Attention
Student Facing
The function \(B\) is defined by the equation \(B(x) = 10x + 25\). Use graphing technology to:
-
Find the value of each expression:
\(B(6)\)
\(B(2.75)\)
\(B(1.482)\)
-
Solve each equation:
\(B(x) = 93\)
\(B(x) = 42.1\)
\(B(x) = 116.25\)
Student Response
For access, consult one of our IM Certified Partners.
Activity Synthesis
Invite students to share any insights they had while using the graphing tool and techniques to evaluate expressions and solve equations. In what ways might the tool and techniques be handy? When might they be limited?
Also discuss any issues that students encountered while completing the task—technical or otherwise.
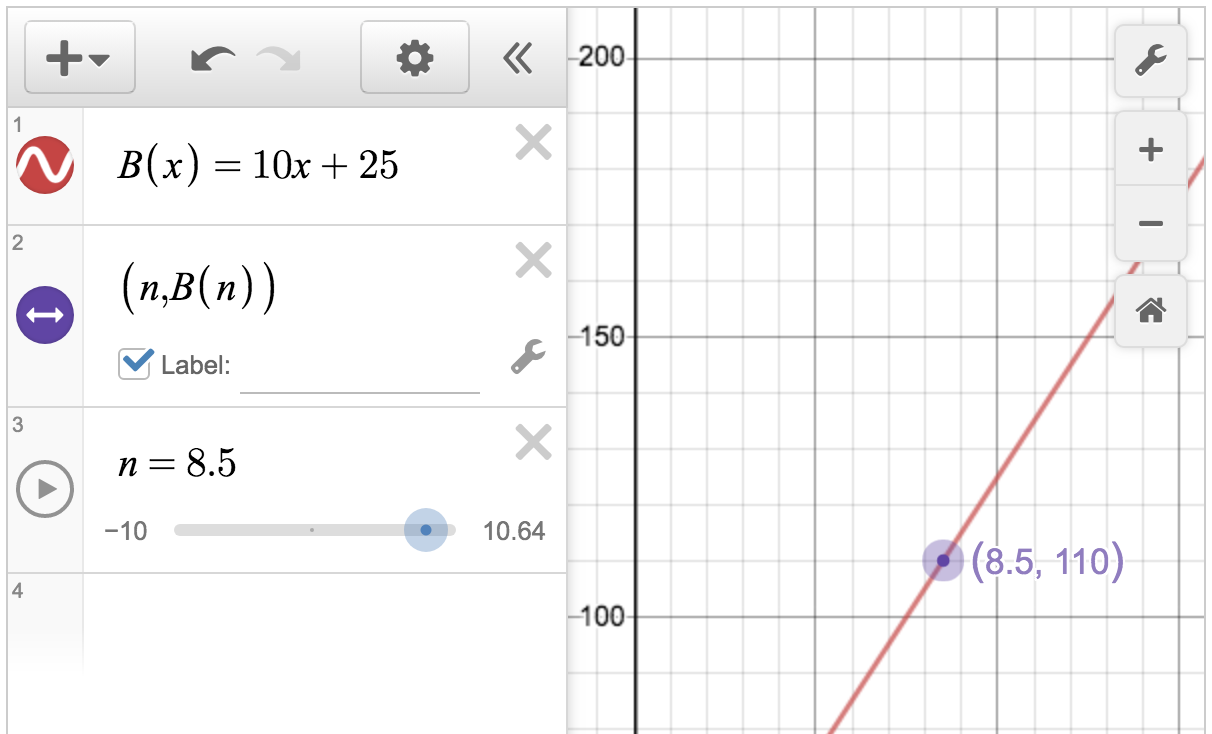
If desired, consider showing another way to obtain input-output pairs of a function in Desmos.
Let’s assign a new input variable, say \(n\), to function \(B\). If we enter \((n, B(n))\) in the expression list, activate a slider for \(n\), and enable the option to label points, the graph will show the coordinate pair for any value of \(n\).
Design Principle(s): Support sense-making; Cultivate conversation
Lesson Synthesis
Lesson Synthesis
Refer back to the activity about data plans. Display the two graphs for all to see.
Ask students to use the graphs to find:
- the values of \(A(0.8)\) and \(B(0.8)\)
- the solutions to \(A(x) = 72\) and \(B(x) = 72\)

Next, display the two equations for all to see. (Hold off on discussing students’ responses.)
Ask students to use the equations to find the same four values as they have just found using the graphs.
\(A(x)=60\)
\(B(x)=10x+25\)
Invite students to compare and contrast the graphical and algebraic approaches for finding unknown inputs and outputs of linear functions. Discuss questions such as:
- “How easy was it to use the graph of \(B\) to find an output value such as \(B(0.8)\)? What about using the graph to find an input value, such as the \(x\) in \(B(x)=72\)?” (Both were fairly straightforward, but may not have been very precise. Some estimation was necessary. It was very easy to see that there was no solution to \(A(x)=72\).)
- “How easy was it to use the rule \(B(x)=10x+25\) to find an output value such as \(B(0.8)\)? What about finding an input value, such as the \(x\) in \(B(x)=72\)?” (Both were fairly simple, but if the rule or the given input or output involves numbers that are harder to compute by hand, it might be more complicated.)
If students did the optional activity on using graphing technology, ask students to identify some ways that technology could help to find unknown input and output values of a function.
5.4: Cool-down - A Third Option (5 minutes)
Cool-Down
For access, consult one of our IM Certified Partners.
Student Lesson Summary
Student Facing
Knowing the rule that defines a function can be very useful. It can help us to:
-
Find the output when we know the input.
- If the rule \(f(x) = 5(x+2)\) defines \(f\), we can find \(f(100)\) by evaluating \(5(100+2)\).
- If \(m(x) = 3-\frac12x \) defines function \(m\), we can find \(m(10)\) by evaluating \(3-\frac12(10)\).
-
Create a table of values.
Here are tables representing functions \(f\) and \(m\):
\(x\) \(f(x)=5(x+2)\) 0 10 1 15 2 20 3 25 4 30 \(x\) \(m(x)=3-\frac12x\) 0 3 1 \(2\frac12\) 2 2 3 \(1\frac12\) 4 1 -
Graph the function. The horizontal values represent the input, and the vertical values represent the output.
For function \(f\), the values of \(f(x)\) are the vertical values, which are often labeled \(y\), so we can write \(y=f(x)\). Because \(f(x)\) is defined by the expression \(5(x+2)\), we can graph \(y=5(x+2)\).
For function \(m\), we can write \(y = m(x)\) and graph \(y=3- \frac12x\).


-
Find the input when we know the output.
Suppose the output of function \(f\) is 65 at some value of \(x\), or \(f(x)=65\), and we want to find out what that value is. Because \(f(x)\) is equal to \(5(x+2)\), we can write \(5(x+2)=65\) and solve for \(x\).
\(\begin{align}5(x+2)&=65\\ x+2 &=13\\ x&=11 \end {align}\)
Each function here is a linear function because the value of the function changes by a constant rate and its graph is a line.