Lesson 18
Using Functions to Model Battery Power
18.1: Devices (5 minutes)
Warm-up
The modeling activities in this lesson center on electronic devices. This warm-up activates students’ knowledge and personal experience with such devices, preparing them for the mathematical work ahead.
Students may not have a good sense for the answer to the last question (about comparing the lengths of charging time if the device started out with different levels of power). This is fine, as students will do some modeling with specific data later in the lesson.
Launch
Arrange students in groups of 2. Give students 1–2 minutes of quiet think time (it is not necessary that students write responses to each question). Then, ask them to share their responses with their partner. Follow with a brief whole-class discussion.
Student Facing
Think about an electronic device with a battery that you have to charge on a regular basis.
- What device is it?
- When you are using the device, about how long does it take the battery to go from 100% charged until the time you plug it in again to recharge?
- About how long does it take to charge to 100% starting from 0% or nearly 0%?
-
Suppose you plugged in your device when the battery was 50% charged.
How long do you think it would take to recharge the device to 100% compared to the time it would take if the device was at 0%? Would it be exactly half the time, more than half the time, or less than half the time it would take if starting from 0%?
Student Response
For access, consult one of our IM Certified Partners.
Activity Synthesis
Invite students to share their characterization of the time it takes to drain and charge the battery on their device. Students are likely to bring up different factors affecting how long their device would stay charged, such as how it is used and how long or how frequently it is used. They may also bring up factors affecting charging time, such as the age of the battery or the quality of the charging cable or wireless charger used.
Highlight that both the battery life of a device after each charge and the length of charging time can vary for many reasons.
18.2: Charging a Phone (20 minutes)
Activity
In this activity, students analyze percentages of battery power as it is being charged, generalize how the quantities are changing, and use their generalization to predict when the battery will be fully charged. The values in the table change at a roughly constant rate, so students are likely to choose a linear model, reason about the average rate of change (which they could do in different ways), and extend that rate of change to make their prediction.
Students apply their understanding of average rate of change and linear relationship to reason about the data and to make a prediction (MP4). If students choose to use graphing technology to help with their analysis, they practice choosing appropriate tools strategically (MP5).
One variation to consider as a follow-up to this activity or to the lesson is to ask students to collect their own data on charging time. This would increase the modeling demand. If students collect their own data, they may find out that batteries tend not to charge linearly all the way to 100%. (Based on the full information, students may decide to use a piecewise function as a refined model and revisit the problem.)
Launch
Design Principle(s): Optimize output; Cultivate conversation
Student Facing
A cell phone is plugged in to be charged. The table shows the percent of battery power at some times after it was plugged in.
| time | percent charged |
|---|---|
| 11:00 a.m. | 6% |
| 11:10 a.m. | 15% |
| 11:30 a.m. | 35% |
| 11:40 a.m. | 43% |
At what time will the battery be 100% charged? Use the data to find out and explain or show your reasoning.
Student Response
For access, consult one of our IM Certified Partners.
Activity Synthesis
Invite students to share their predictions and explanations. Record and display for all to see the different assumptions and choices students made. If students claim that the battery was charging at 9% every 10 minutes, ask for their reasoning. If no students mentioned computing the average rate of change between 11:00 a.m. and 11:40 a.m., ask them about it.
If variations in students' assumptions and choices led to different predictions, or if students used different representations in their reasoning, ask students to compare and contrast the different solution strategies:
- "How are the solution strategies alike? How are they different?"
- "How were the assumptions different in these strategies?
18.3: How Long Will It Last? (20 minutes)
Activity
Previously, students analyzed a set of data on the power levels of a battery as it was being charged. They looked for a model that enabled them to predict when the battery would be 100% charged. In this activity, they engage in a similar, yet more challenging, modeling exercise to determine when a battery would be completely out of power.
Here, students are asked to define a function and then use their function to make some predictions. Then, they evaluate their predictions and adjust the function to account for new information. Data about the situation are presented in a way that may be unfamiliar, so students need to persevere in making sense of quantities and the relationships among them (MP1).
As students work, monitor for those who use different reasoning strategies and representations as they find a model that describes how the battery power was decreasing over time. Select them to share their work later.
No time estimate is specified for this activity as the length would depend on decisions about how students' models are discussed, revised, tested, and presented. If students are to collect data using their own devices, or if they are to prepare a presentation that illustrates their results and their modeling process, additional time will be needed.
Making graphing and statistical technology available gives students an opportunity to choose appropriate tools strategically (MP5).
Launch
Ask students to close their books or devices. Then, display the graph for all to see.
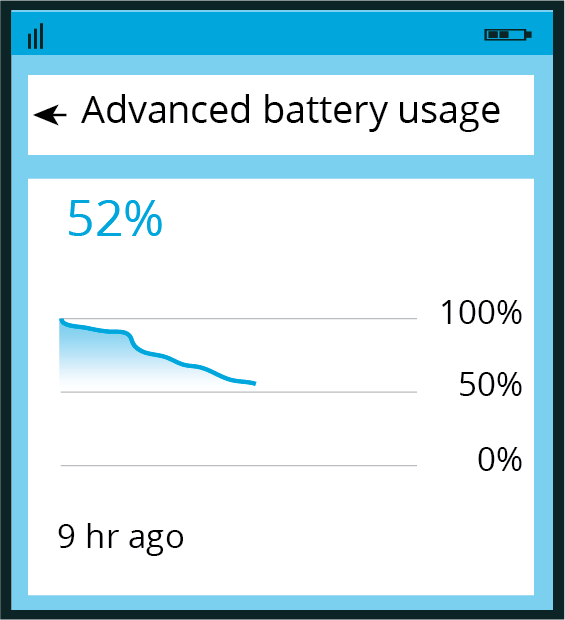
Tell students that the image shows the battery usage for a cell phone for 9 hours after it was fully charged. Give students a moment to observe the image and to make a prediction for how much longer the battery will last.
Poll the class on their predictions and display the predictions for all to see. Then, ask students to work on the activity.
Consider arranging students in groups of 2–4 and asking students to pause for a whole-class discussion after the first set of questions.
Supports accessibility for: Attention; Social-emotional skills
Student Facing
-
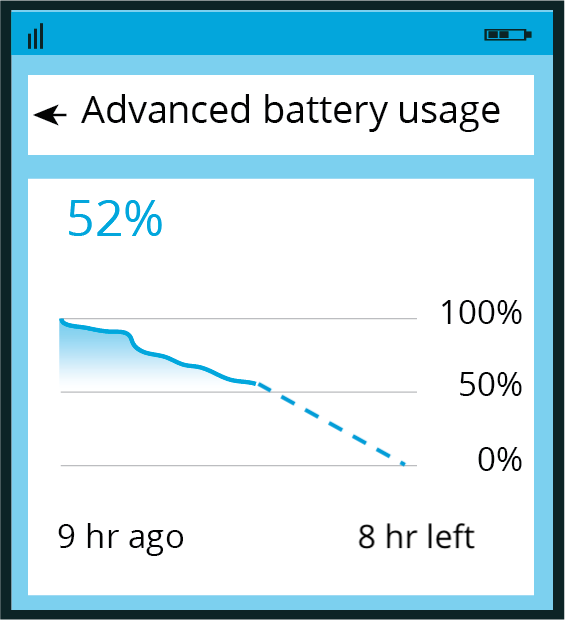
The image shows the battery usage of a cell phone 9 hours since it was fully charged.
It also shows a prediction that the battery would last 8 more hours.
-
Write an equation for a model that fits the data in the image and gives the percent of battery power, \(p\), as a function of time since the phone was fully charged, \(t\). Show your reasoning.
If you get stuck, consider creating a table of values or a scatter plot of the data.
- Based on your function, what percentage of power would the battery have 4 hours after this image was taken? What about 5 hours after the image was taken? Show your reasoning.
-
- Here are two more images showing the battery usage at two later times, before the battery was charged again.
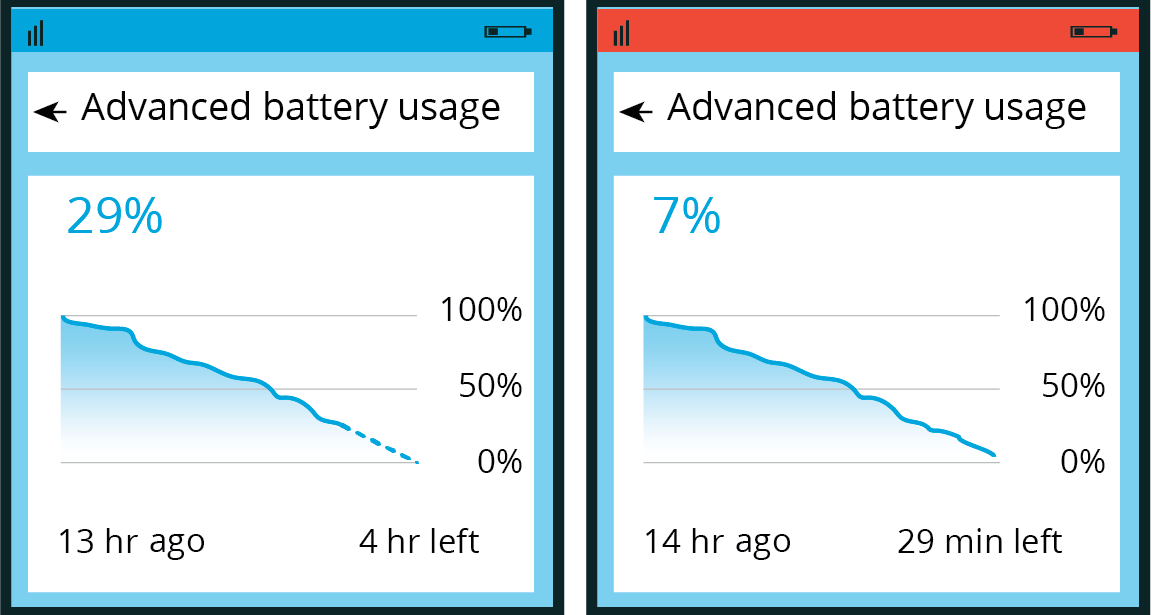
- How well did the function you wrote predict the battery power 4 and 5 hours since the first image was taken (that is, 13 and 14 hours after the battery was fully charged)? Explain or show your reasoning.
- What do you notice from the images about the change in the prediction between \(t=13\) and \(t=14\)?
- Write a new equation for a function that would better fit the data shown in the last image.
Student Response
For access, consult one of our IM Certified Partners.
Student Facing
Are you ready for more?
Would a piecewise function be a better model for capturing the data shown in all three images? If so, what might the rules of that function be?
Student Response
For access, consult one of our IM Certified Partners.
Anticipated Misconceptions
Because the images specify duration of time relative to the moment when they were taken, using phrases such as "9 hours ago" or "8 hours left," students may think that time was measured from a different reference point each time. They may struggle to quantify the changes in time or to organize the values into a table. Ask students to consider when, or at what power level, we typically begin measuring the life of a battery. Clarify that all images referenced the time when the battery was at 100%, so they could use that as a starting point for measuring time,
Activity Synthesis
Select students or groups to share the function they defined for the first set of questions and to explain their reasoning, including the assumptions they made. After each model is shared, ask if others had written the same equation but arrived at it a different way, or had reasoned the same way and made the same assumptions, but arrived at a different model.
Then, focus the discussion on how students refined their original models to account for the new information given in the second question. Showcase the variety of strategies and representations students created to make sense of the additional data or to represent their new function.
Consider using graphing technology to graph (on the same coordinate plane) the different equations students wrote and display the graphs for analysis and comparison.
Design Principle(s): Support sense-making; Maximize meta-awareness