Lesson 4
Dot Plots
Let's investigate what dot plots and bar graphs can tell us.
Problem 1
Clare recorded the amounts of time spent doing homework, in hours per week, by students in sixth, eighth, and tenth grades. She made a dot plot of the data for each grade and provided the following summary.
- Students in sixth grade tend to spend less time on homework than students in eighth and tenth grades.
-
The homework times for the tenth-grade students are more alike than the homework times for the eighth-grade students.
Use Clare's summary to match each dot plot to the correct grade (sixth, eighth, or tenth).
Problem 2
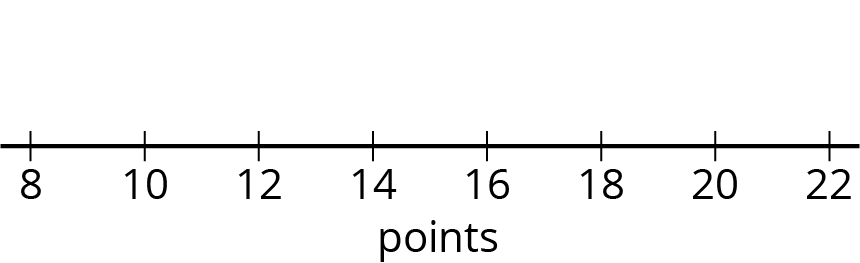
Mai played 10 basketball games. She recorded the number of points she scored and made a dot plot. Mai said that she scored between 8 and 14 points in most of the 10 games, but one game was exceptional. During that game she scored more than double her typical score of 9 points. Use the number line to make a dot plot that fits the description Mai gave.
Problem 3
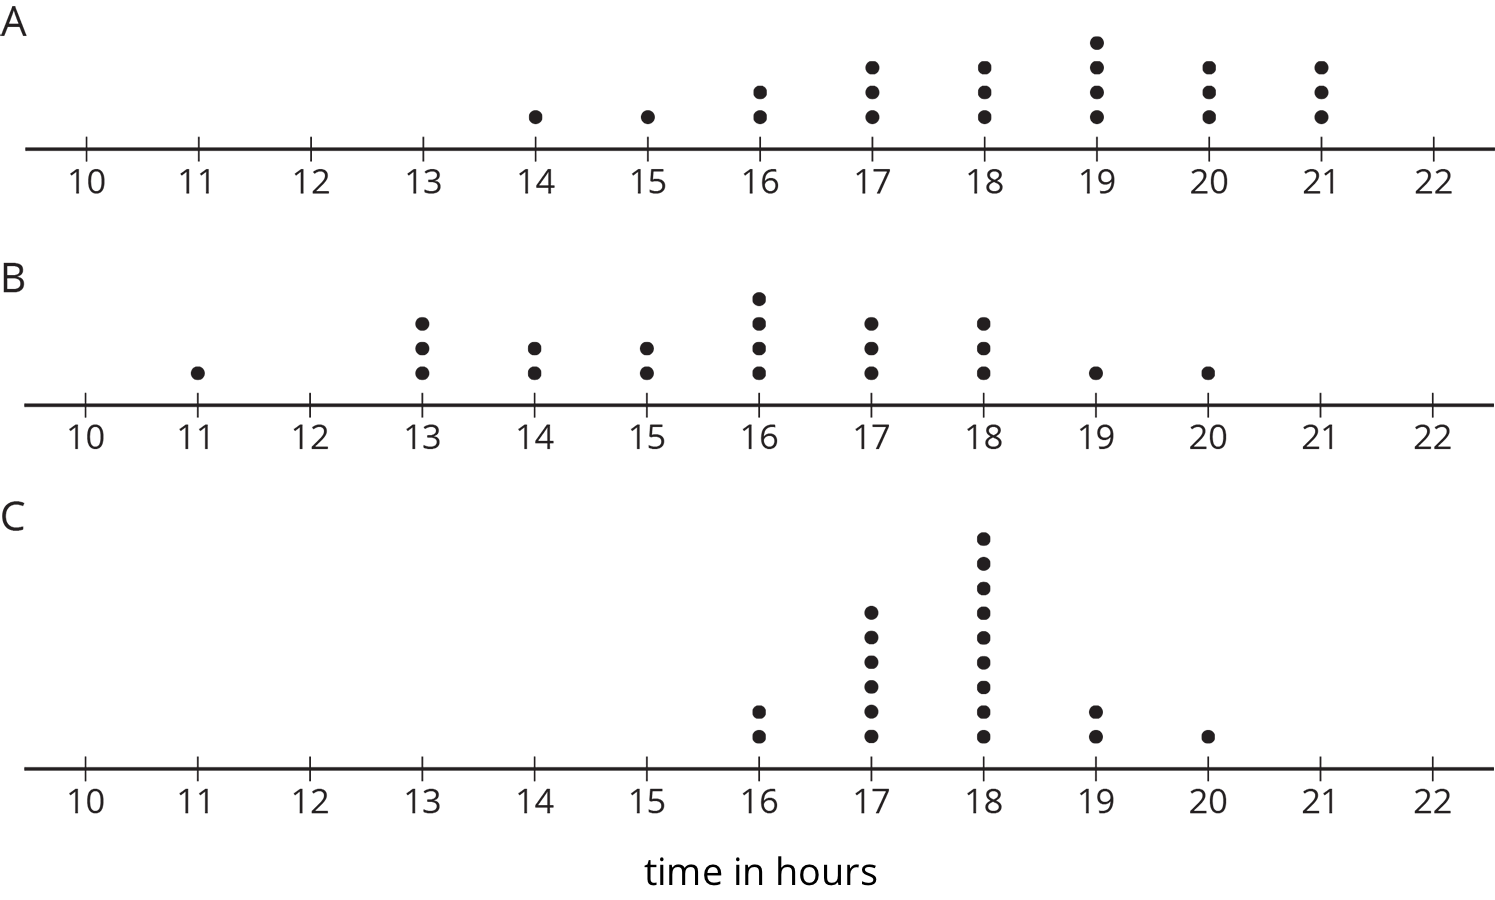
A movie theater is showing three different movies. The dot plots represent the ages of the people who were at the Saturday afternoon showing of each of these movies.

- One of these movies was an animated movie rated G for general audiences. Do you think it was movie A, B, or C? Explain your reasoning.
- Which movie has a dot plot with ages that that center at about 30 years?
- What is a typical age for the people who were at Movie A?
Problem 4
Find the value of each expression.
- \(3.727 + 1.384\)
- \(3.727 - 1.384\)
- \(5.01 \boldcdot 4.8\)
- \(5.01 \div 4.8\)