Lesson 9
Mean
Let’s explore the mean of a data set and what it tells us.
9.1: Close to Four
Use the digits 0–9 to write an expression with a value as close as possible to 4. Each digit can be used only one time in the expression.
\(\displaystyle \left(\boxed{\phantom{TEST}}+ \boxed{\phantom{TEST}}+ \boxed{\phantom{TEST}}+ \boxed{\phantom{TEST}} \right) \div 4\)
9.2: Spread Out and Share
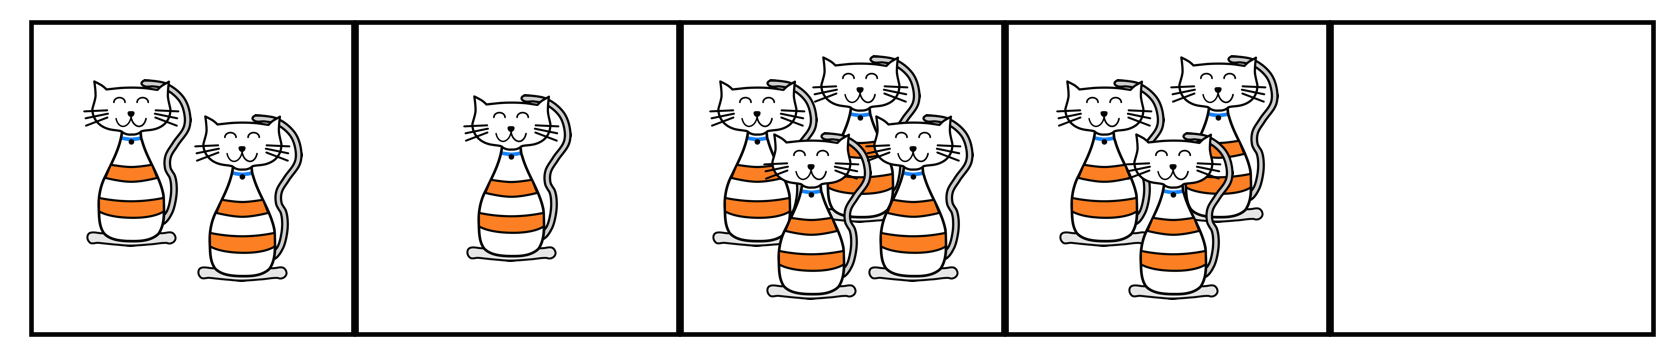
- The kittens in a room at an animal shelter are arranged in five crates, as shown.
-
The manager of the shelter wants the kittens distributed equally among the crates. How might that be done? How many kittens will end up in each crate?
-
The number of kittens in each crate after they are equally distributed is called the mean number of kittens per crate, or the average number of kittens per crate.
Explain how the expression \(10 \div 5\) is related to the average.
-
Another room in the shelter has 6 crates. No two crates contain the same number of kittens, and there is an average of 3 kittens per crate.
Draw or describe at least two different arrangements of kittens that match this description. You may choose to use the applet to help.
-
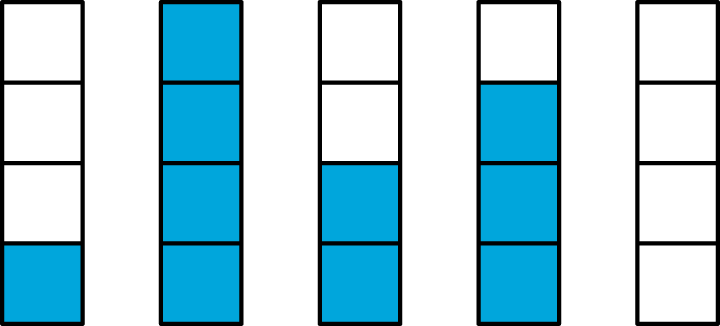
- Five servers were scheduled to work the number of hours shown. They decided to share the workload, so each one would work equal hours.
- Server A: 3
- Server B: 6
- Server C: 11
- Server D: 7
- Server E: 4
- On the grid on the left, draw 5 bars whose heights represent the hours worked by servers A, B, C, D, and E.
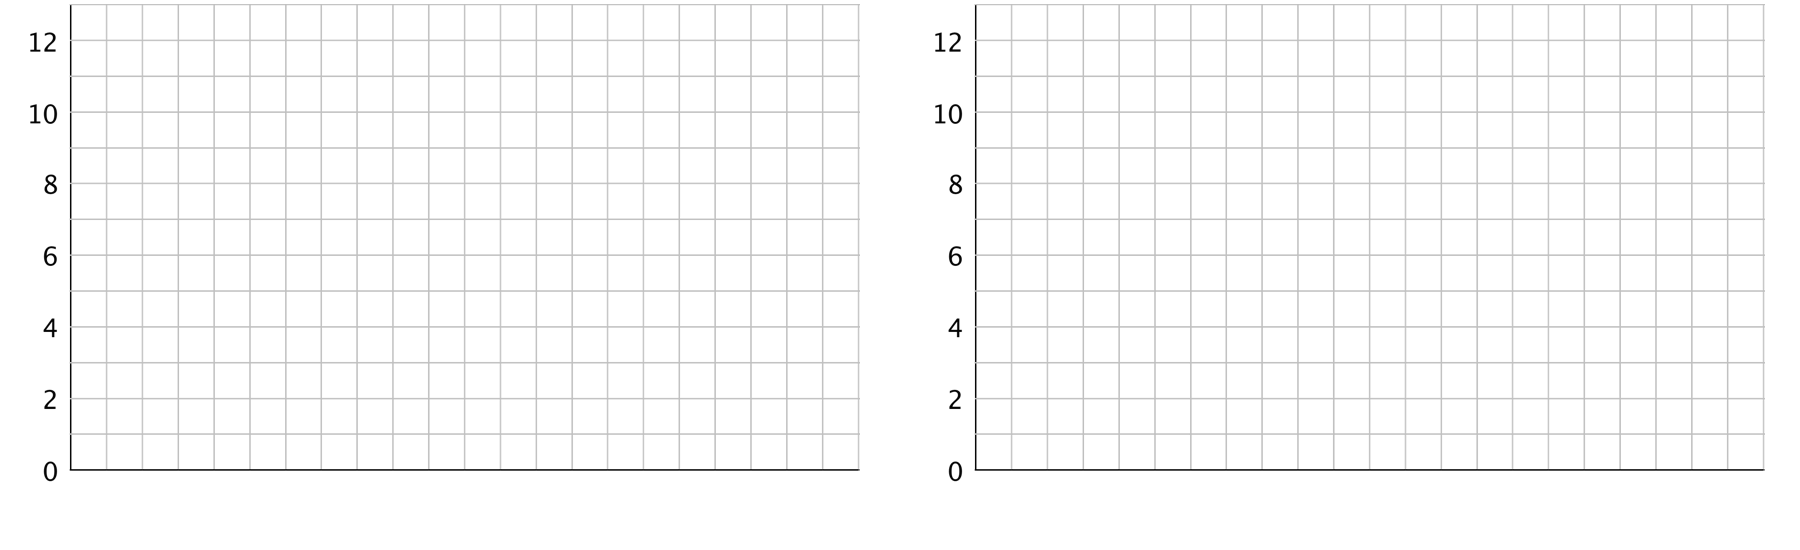
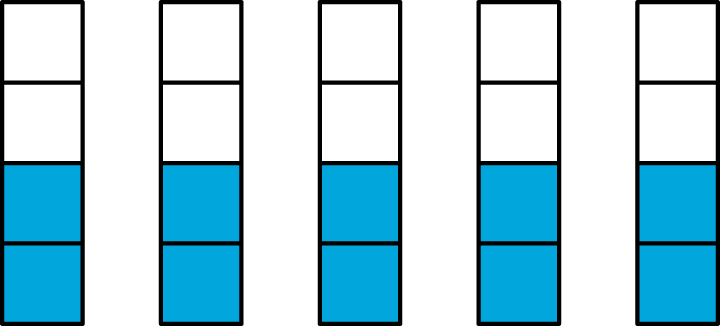
- Think about how you would rearrange the hours so that each server gets a fair share. Then, on the grid on the right, draw a new graph to represent the rearranged hours. Be prepared to explain your reasoning.
- Based on your second drawing, what is the average or mean number of hours that the servers will work?
- Explain why we can also find the mean by finding the value of \(31 \div 5\).
- Which server will see the biggest change to work hours? Which server will see the least change?
Server F, working 7 hours, offers to join the group of five servers, sharing their workload. If server F joins, will the mean number of hours worked increase or decrease? Explain how you know.
9.3: Getting to School
For the past 12 school days, Mai has recorded how long her bus rides to school take in minutes. The times she recorded are shown in the table.
9
8
6
9
10
7
6
12
9
8
10
8
- Find the mean for Mai’s data. Show your reasoning.
- In this situation, what does the mean tell us about Mai’s trip to school?
-
For 5 days, Tyler has recorded how long his walks to school take in minutes. The mean for his data is 11 minutes. Without calculating, predict if each of the data sets shown could be Tyler’s. Explain your reasoning.
- data set A: 11, 8, 7, 9, 8
- data set B: 12, 7, 13, 9, 14
- data set C: 11, 20, 6, 9, 10
- data set D: 8, 10, 9, 11, 11
- Determine which data set is Tyler’s. Explain how you know.
Summary
Sometimes a general description of a distribution does not give enough information, and a more precise way to talk about center or spread would be more useful. The mean, or average, is a number we can use to summarize a distribution.
We can think about the mean in terms of “fair share” or “leveling out.” That is, a mean can be thought of as a number that each member of a group would have if all the data values were combined and distributed equally among the members.
For example, suppose there are 5 bottles which have the following amounts of water: 1 liter, 4 liters, 2 liters, 3 liters, and 0 liters.
To find the mean, first we add up all of the values. We can think of this as putting all of the water together: \(1+4+2+3+0=10\).

To find the “fair share,” we divide the 10 liters equally into the 5 containers: \(10\div 5 = 2\).
Suppose the quiz scores of a student are 70, 90, 86, and 94. We can find the mean (or average) score by finding the sum of the scores \((70+90+86+94=340)\) and dividing the sum by four \((340 \div 4 = 85)\). We can then say that the student scored, on average, 85 points on the quizzes.
In general, to find the mean of a data set with \(n\) values, we add all of the values and divide the sum by \(n\).
Glossary Entries
- average
The average is another name for the mean of a data set.
For the data set 3, 5, 6, 8, 11, 12, the average is 7.5.
\(3+5+6+8+11+12=45\)
\(45 \div 6 = 7.5\)
- mean
The mean is one way to measure the center of a data set. We can think of it as a balance point. For example, for the data set 7, 9, 12, 13, 14, the mean is 11.

To find the mean, add up all the numbers in the data set. Then, divide by how many numbers there are. \(7+9+12+13+14=55\) and \(55 \div 5 = 11\).