Lesson 18
Using Data to Solve Problems
Let's compare data sets using visual displays.
18.1: Wild Bears
In one study on wild bears, researchers measured the head lengths and head widths, in inches, of 143 wild bears. The ages of the bears ranged from newborns (0 years) to 15 years. The box plots summarize the data from the study.

- Write four statistical questions that could be answered using the box plots: two questions about the head length and two questions about the head width.
-
Trade questions with your partner.
- Decide if each question is a statistical question.
- Use the box plots to answer each question.
18.2: Math Homework (Part 1)
Over a two-week period, Mai recorded the number of math homework problems she had each school day.
- 2
- 15
- 20
- 0
- 5
- 25
- 1
- 0
- 10
- 12
-
Calculate the following. Show your reasoning.
- The mean number of math homework problems.
- The mean absolute deviation (MAD).
- Interpret the mean and MAD. What do they tell you about the number of homework problems Mai had over these two weeks?
-
Find or calculate the following values and show your reasoning.
- The median, quartile, maximum, and minimum of the same data on Mai’s math homework problems.
- The interquartile range (IQR).
- Which pair of measures of center and variability—mean and MAD, or median and IQR—do you think summarize the distribution of Mai’s math homework assignments better? Explain your reasoning.
You may use the applet below to help if you choose to. Begin by dragging the left edge across the screen until you see only one column in the spreadsheet. Enter the values needed to calculate the IQR and the mean when prompted.
18.3: Math Homework (Part 2)
Jada wanted to know whether a dot plot, a histogram, or a box plot would best summarize the center, variability, and other aspects of her homework data.
- 2
- 15
- 20
- 0
- 5
- 25
- 1
- 0
- 10
- 12
-
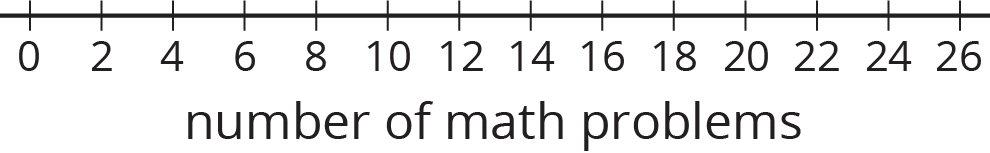
Use the axis to make a dot plot to represent the data. Mark the position of the mean, which you calculated earlier, on the dot plot using a triangle (\(\Delta\)). From the triangle, draw a horizontal line segment to the left and right sides to represent the MAD.
-
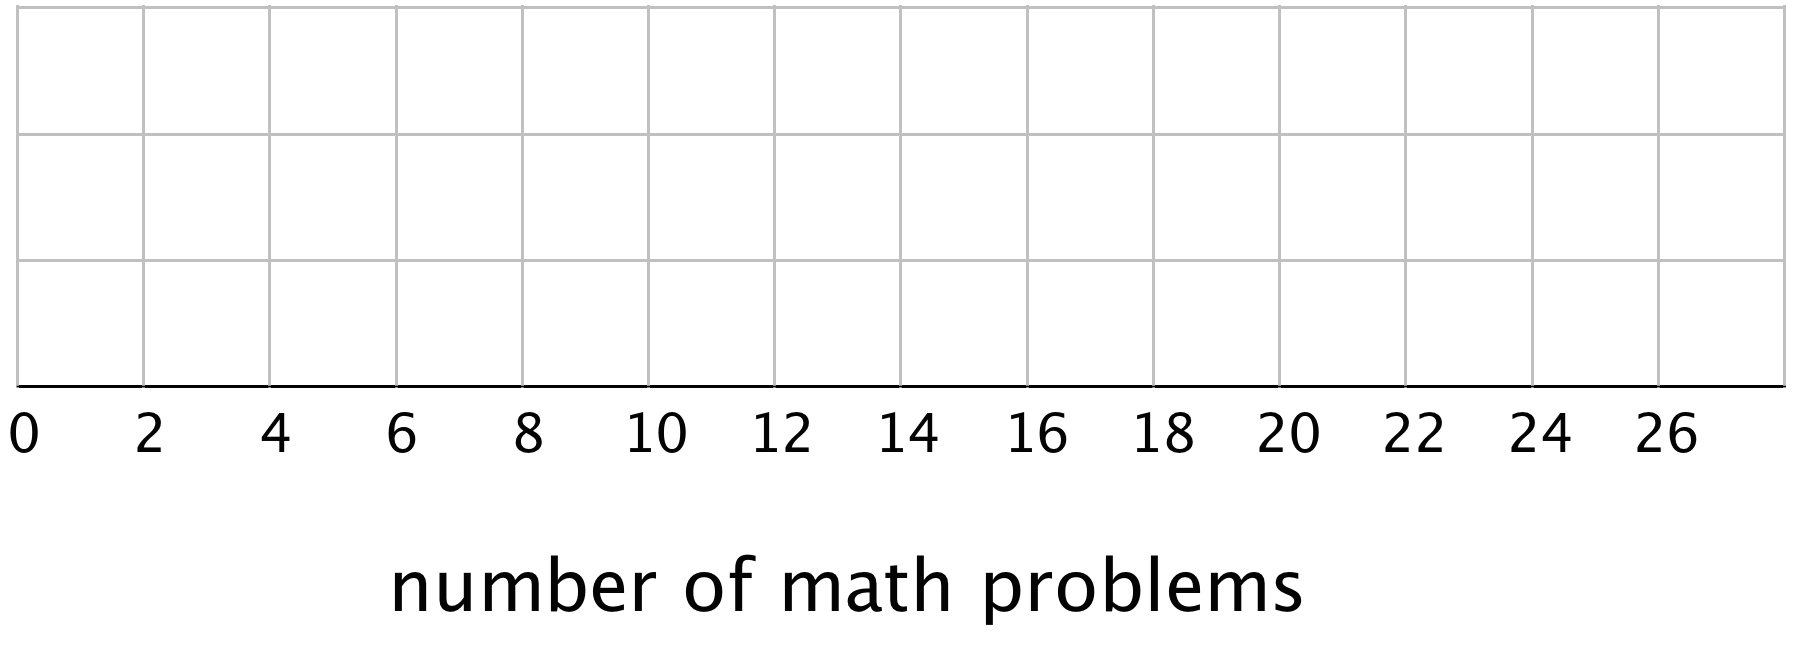
Use the five-number summary from the previous task and the grid to draw a box plot that represents Jada’s homework data.
-
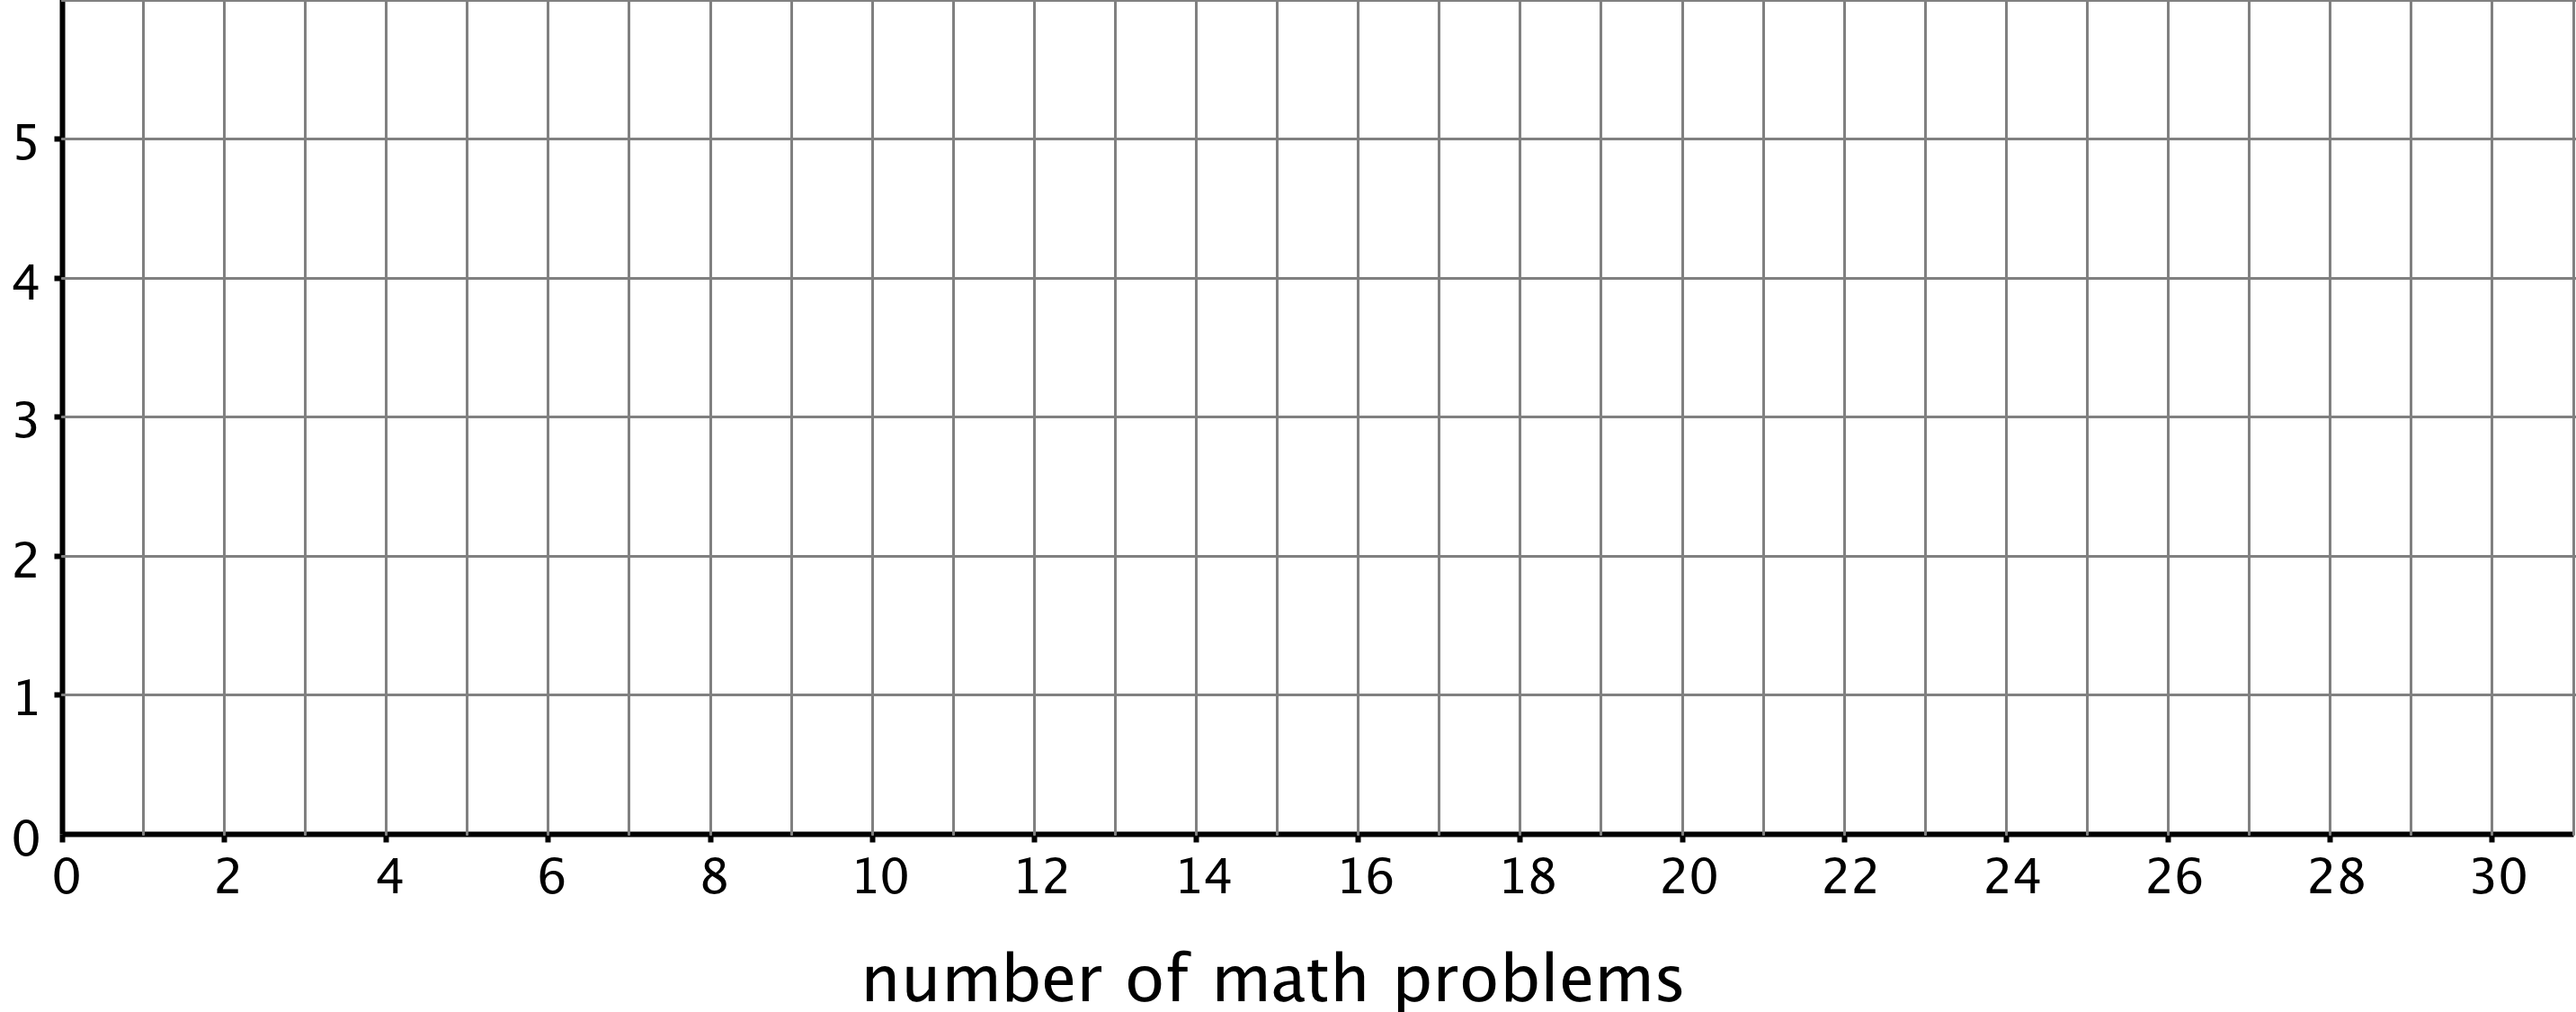
Work with your group to draw three histograms to represent Jada’s homework data. The width of the bars in each histogram should represent a different number of homework problems, as specified.
- The width of one bar represents 10 problems.

- The width of one bar represents 5 problems.
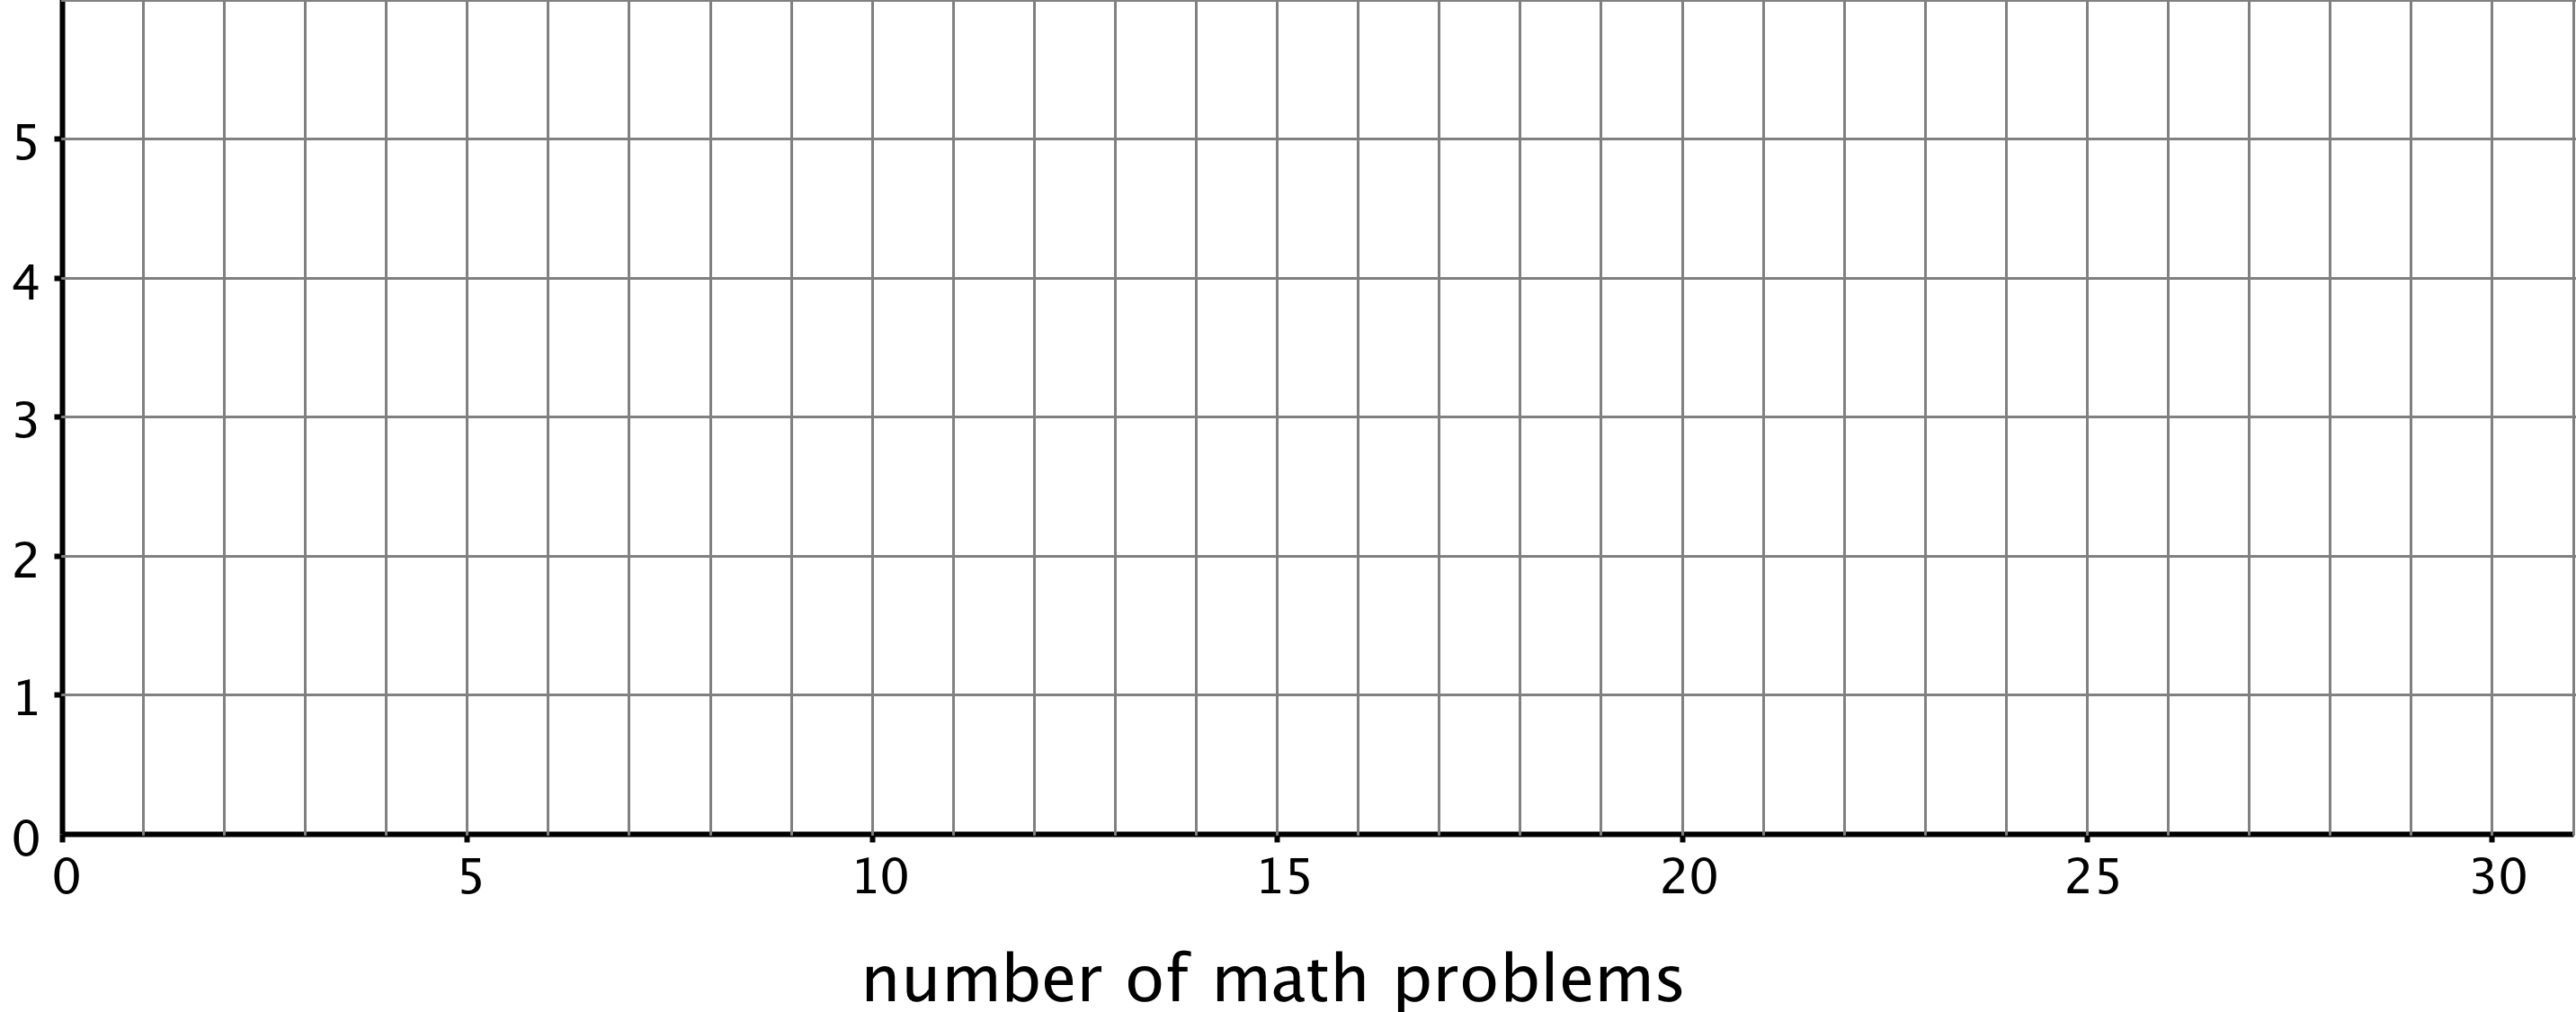
- The width of one bar represents 2 problems.
- The width of one bar represents 10 problems.
- Which of the five representations should Jada use to summarize her data? Should she use a dot plot, box plot, or one of the histograms? Explain your reasoning.
You can use the applet to make each type of graph if you choose to. Begin by dragging the gray bar from the top of the applet down until you see all of the command boxes.
18.4: Will the Yellow Perch Survive?
Scientists studying the yellow perch, a species of fish, believe that the length of a fish is related to its age. This means that the longer the fish, the older it is. Adult yellow perch vary in size, but they are usually between 10 and 25 centimeters.
Scientists at the Great Lakes Water Institute caught, measured, and released yellow perch at several locations in Lake Michigan. The following summary is based on a sample of yellow perch from one of these locations.
| length of fish in centimeters | number of fish |
|---|---|
| 0 to less than 5 | 5 |
| 5 to less than 10 | 7 |
| 10 to less than 15 | 14 |
| 15 to less than 20 | 20 |
| 20 to less than 25 | 24 |
| 25 to less than 30 | 30 |
-
Use the data to make a histogram that shows the lengths of the captured yellow perch. Each bar should contain the lengths shown in each row in the table.
- How many fish were measured? How do you know?
-
Use the histogram to answer the following questions.
-
How would you describe the shape of the distribution?
- Estimate the median length for this sample. Describe how you made this estimate.
- Predict whether the mean length of this sample is greater than, less than, or nearly equal to the median length for this sample of fish? Explain your prediction.
- Would you use the mean or the median to describe a typical length of the fish being studied? Explain your reasoning.
-
-
Based on your work so far:
- Would you describe a typical age for the yellow perch in this sample as: “young,” “adult,” or “old”? Explain your reasoning.
- Some researchers are concerned about the survival of the yellow perch. Do you think the lengths (or the ages) of the fish in this sample are something to worry about? Explain your reasoning.
Summary
The dot plot shows the distribution of 30 cookie weights in grams.

The mean cookie weight, marked by the triangle, is 21 grams. This tells us that if the weights of all of the cookies were redistributed so they all had the same weight, each cookie would weigh 21 grams. The MAD is 5.6 grams, which suggests that a cookie typically weighs between 15.4 grams and 26.6 grams.
The box plot for the same data set is shown above the dot plot. The median shows that half of the weights are greater than or equal to 20.5 grams, and half are less than or equal to 20.5 grams. The box shows that the IQR is 10 and that the middle half of the cookies weigh between 16 and 26 grams.
In this case, the median weight is very close to the mean weight, and the IQR is about twice the MAD. This tells us that the two pairs of measures of center and spread are very similar.
Now let’s look at another example of 30 different cookies.

Here the mean is 21 grams, and the MAD is 3.4 grams. This suggests that a cookie typically weighs between 17.6 and 24.4 grams. The median cookie weight is 23 grams, and the box plot shows that the middle half of the data are between 20 and 24 grams. These two pairs of measures paint very different pictures of the variability of the cookie weights.
The median (23 grams) is closer to the middle of the big cluster of values. If we were to ignore the smaller cookies, the median and IQR would give a more accurate picture of how much a cookie typically weighs.
When a distribution is not symmetrical, the median and IQR are often better measures of center and spread than the mean and MAD. However the decision on which pair of measures to use depends on what we want to know about the group we are investigating.