Lesson 3
Representing Data Graphically
Let’s represent data with dot plots and bar graphs.
Problem 1
A teacher drew a line segment that was 20 inches long on the blackboard. She asked each of her students to estimate the length of the segment and used their estimates to draw this dot plot.

- How many students were in the class?
- Were students generally accurate in their estimates of the length of the line? Explain your reasoning.
Problem 2
Here are descriptions of data sets. Select all descriptions of data sets that could be graphed as dot plots.
Class size for the classes at an elementary school
Colors of cars in a parking lot
Favorite sport of each student in a sixth-grade class
Birth weights for the babies born during October at a hospital
Number of goals scored in each of 20 games played by a school soccer team
Problem 3
Priya recorded the number of attempts it took each of 12 of her classmates to successfully throw a ball into a basket. Make a dot plot of Priya’s data.
1
2
1
3
1
4
4
3
1
2
5
2
Problem 4
Solve each equation.
- \(9v=1\)
- \(1.37w=0\)
- \(1=\frac{7}{10}x\)
- \(12.1=12.1+y\)
- \(\frac35+z=1\)
Problem 5
Find the quotients.
- \(\frac25\div2\)
- \(\frac25\div5\)
- \(2\div\frac25\)
- \(5\div\frac25\)
Problem 6
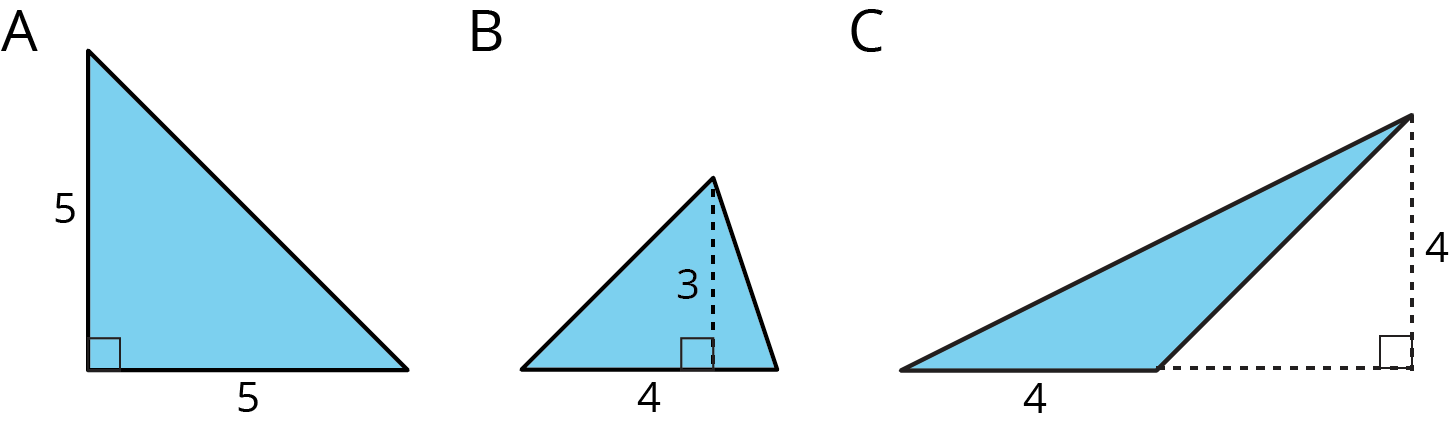
Find the area of each triangle.