Lesson 17
Using Box Plots
Let's use box plots to make comparisons.
Problem 1
Here are box plots that summarize the heights of 20 professional male athletes in basketball, football, hockey, and baseball.

- In which two sports are the players’ height distributions most alike? Explain your reasoning.
- Which sport shows the greatest variability in players’ heights? Which sport shows the least variability?
Problem 2
Here is a box plot that summarizes data for the time, in minutes, that a fire department took to respond to 100 emergency calls.
Select all the statements that are true, according to the dot plot.
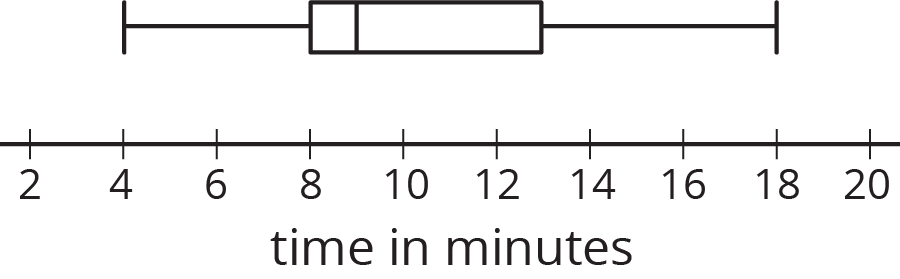
Most of the response times were under 13 minutes.
Fewer than 30 of the response times were over 13 minutes.
More than half of the response times were 11 minutes or greater.
There were more response times that were greater than 13 minutes than those that were less than 9 minutes.
About 75% of the response times were 13 minutes or less.
Problem 3
Pineapples were packed in three large crates. For each crate, the weight of every pineapple in the crate was recorded. Here are three box plots that summarize the weights in each crate.
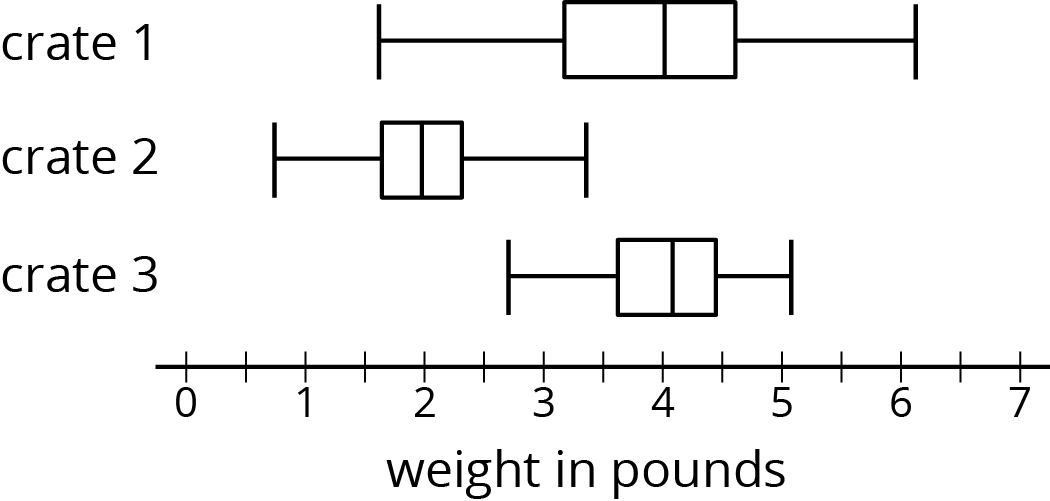
Select all of the statements that are true, according to the box plots.
The weights of the pineapples in Crate 1 were the most variable.
The heaviest pineapple was in Crate 1.
The lightest pineapple was in Crate 1.
Crate 3 had the greatest median weight and the greatest IQR.
More than half the pineapples in Crate 1 and Crate 3 were heavier than the heaviest pineapple in Crate 2.
Problem 4
Two TV shows each asked 100 viewers for their ages. For one show, the mean age of the viewers was 35 years and the MAD was 20 years. For the other show, the mean age of the viewers was 30 years and the MAD was 5 years.
A sixth-grade student says he watches one of the shows. Which show do you think he watches? Explain your reasoning.