Lesson 23
Looking for Associations
Let’s look for associations in data.
Problem 1
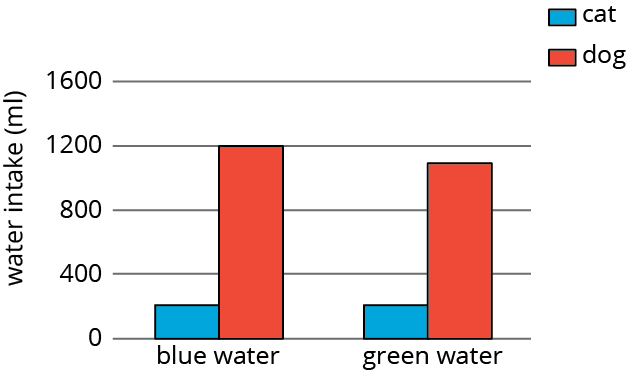
A scientist wants to know if the color of the water affects how much animals drink. The average amount of water each animal drinks was recorded in milliliters for a week and then graphed. Is there evidence to suggest an association between water color and animal?
| cat intake (ml) | dog intake (ml) | total (ml) | |
|---|---|---|---|
| blue water | 210 | 1200 | 1410 |
| green water | 200 | 1100 | 1300 |
| total | 410 | 2300 | 2710 |
Problem 2
A farmer brings his produce to the farmer’s market and records whether people buy lettuce, apples, both, or something else.
| bought apples | did not buy apples | |
|---|---|---|
| bought lettuce | 14 | 58 |
| did not buy lettuce | 8 | 29 |
Make a table that shows the relative frequencies for each row. Use this table to decide if there is an association between buying lettuce and buying apples.
Problem 3
Researchers at a media company want to study news-reading habits among different age groups. They tracked print and online subscription data and made a 2-way table.
| internet media | print media | |
|---|---|---|
| 18-25 year olds | 151 | 28 |
| 26-45 year olds | 132 | 72 |
| 46-65 year olds | 48 | 165 |
- Create a segmented bar graph using one bar for each row of the table.
- Is there an association between age groups and the method they use to read articles? Explain your reasoning.
Problem 4
Using the data in the scatter plot, what is a reasonable slope of a model that fits this data?
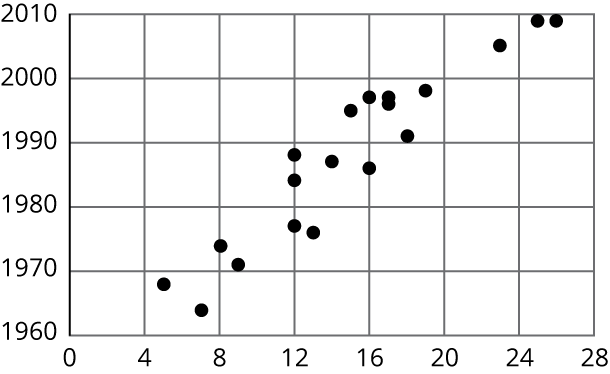
-2.5
-1
1
2.5