Lesson 22
Observing More Patterns in Scatter Plots
Problem 1
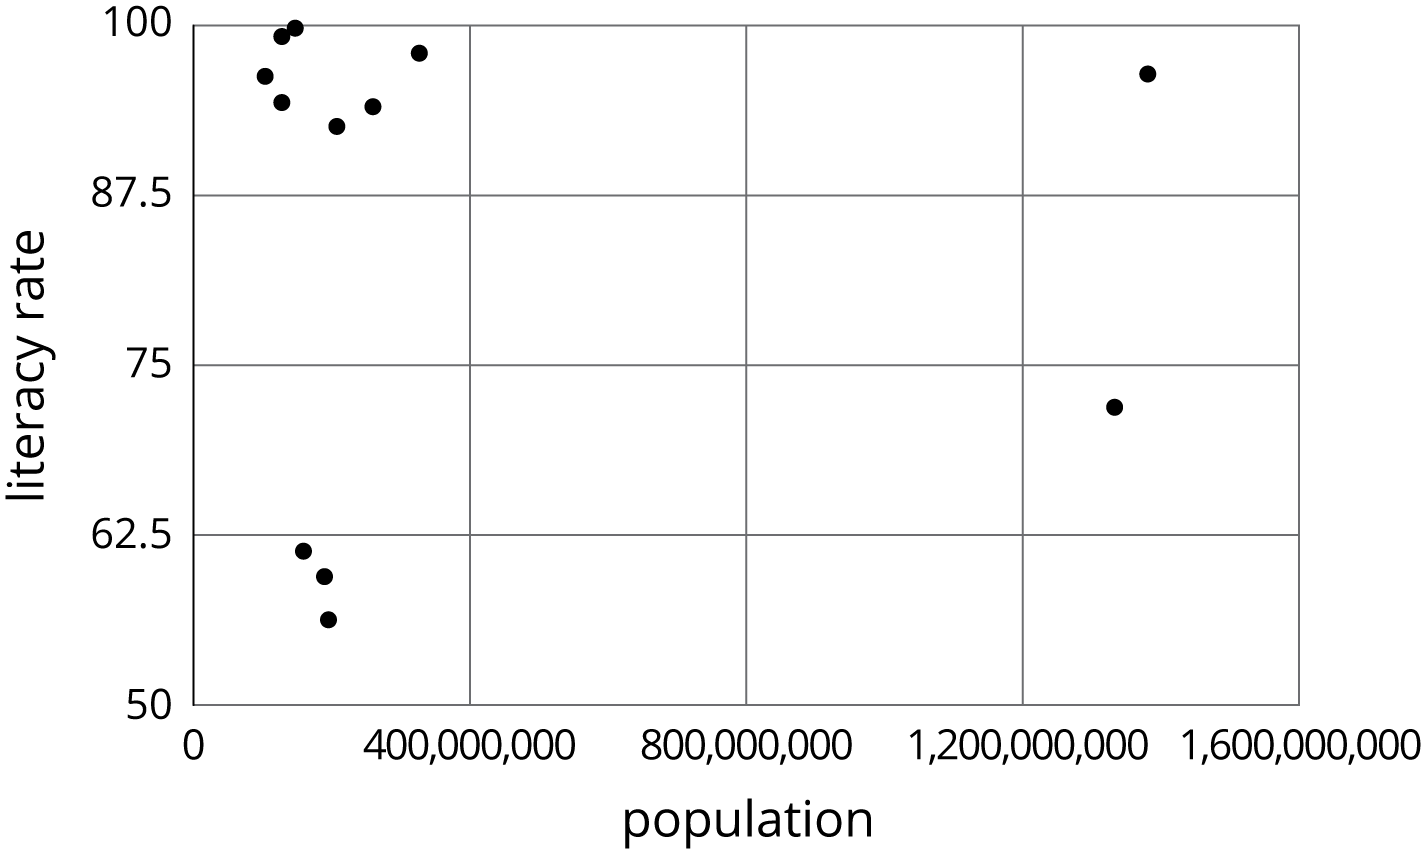
Literacy rate and population for the 12 countries with more than 100 million people are shown in the scatter plot. Circle any clusters in the data.
Problem 2
Here is a scatter plot:
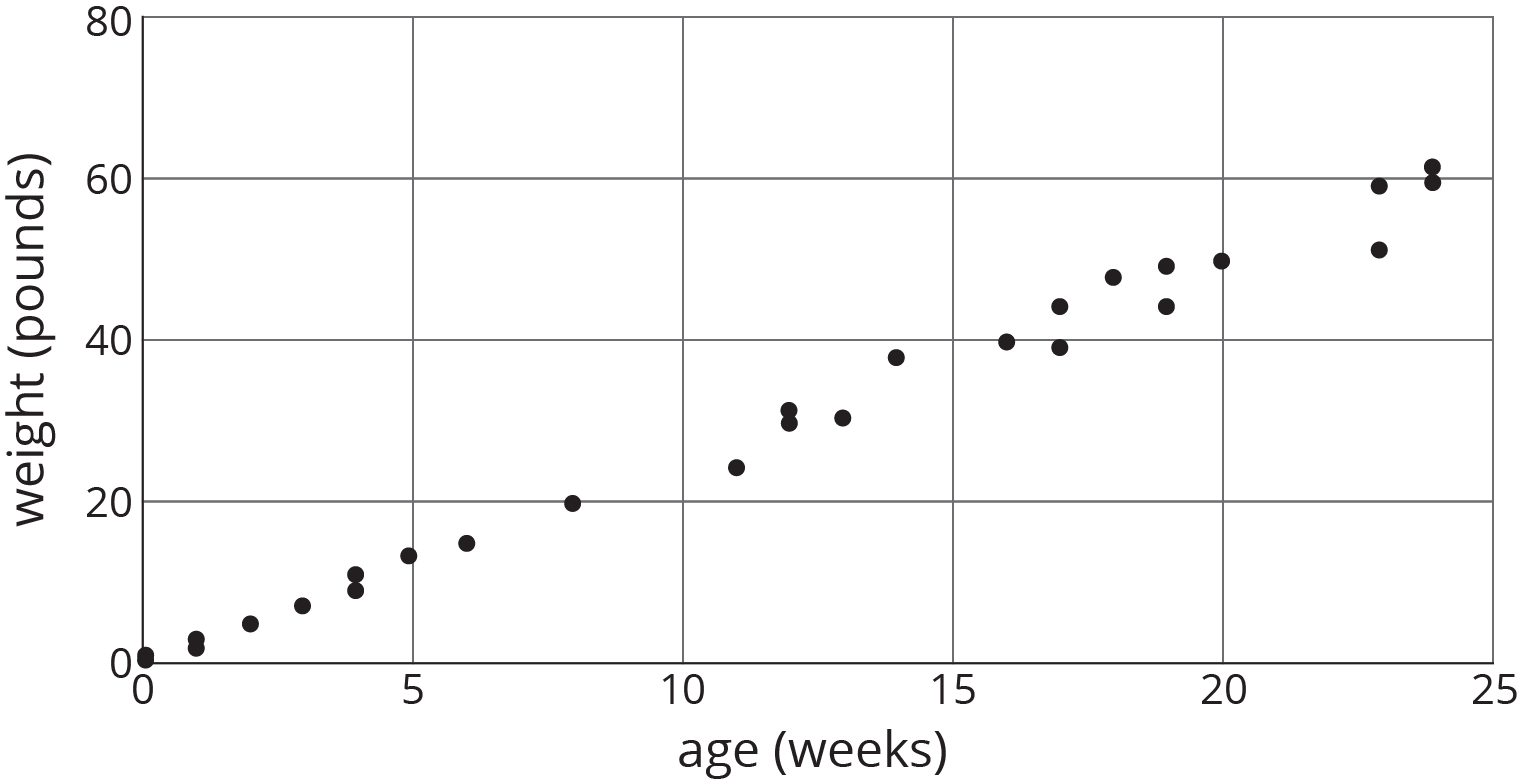
Select all the following that describe the association in the scatter plot:
Linear association
Non-linear association
Positive association
Negative association
No association
Problem 3
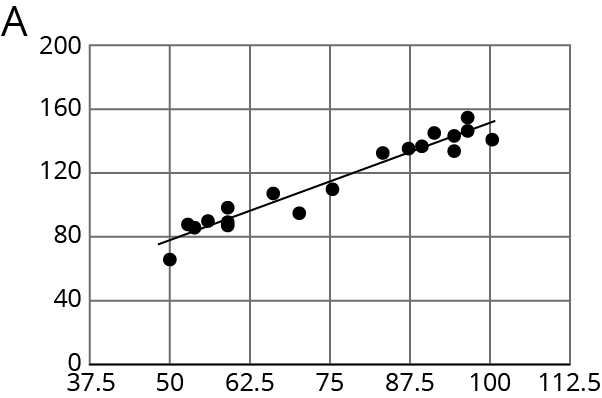
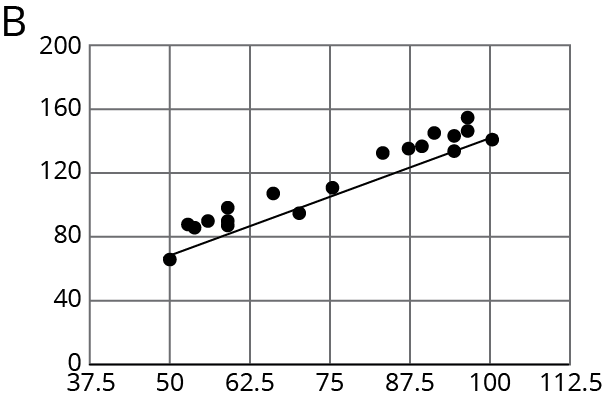
For the same data, two different models are graphed. Which model more closely matches the data? Explain your reasoning.
Problem 4
Here is a scatter plot of data for some of the tallest mountains on Earth.
The heights in meters and year of first recorded ascent is shown. Mount Everest is the tallest mountain in this set of data.
- Estimate the height of Mount Everest.
- Estimate the year of the first recorded ascent of Mount Everest.

Problem 5
Different stores across the country sell a book for different prices. The table shows the price of the book in dollars and the number of books sold at that price.
| price in dollars | number sold |
|---|---|
| 11.25 | 53 |
| 10.50 | 60 |
| 12.10 | 30 |
| 8.45 | 81 |
| 9.25 | 70 |
| 9.75 | 80 |
| 7.25 | 120 |
| 12 | 37 |
| 9.99 | 130 |
| 7.99 | 100 |
| 8.75 | 90 |
- Draw a scatter plot of this data. Label the axes.
- Are there any outliers? Explain your reasoning.
- If there is a relationship between the variables, explain what it is.
- Remove any outliers, and draw a line that you think is a good fit for the data.