Lesson 21
The Slope of a Fitted Line
Let's look at how changing one variable changes another.
Problem 1
Which of these statements is true about the data in the scatter plot?
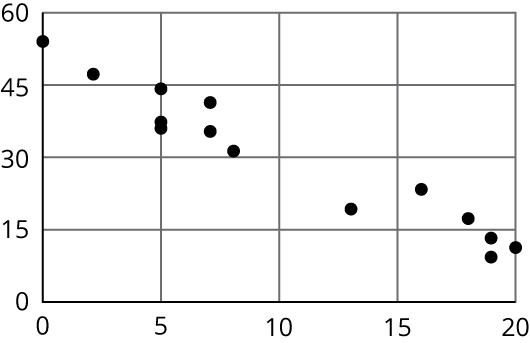
As \(x\) increases, \(y\) tends to increase.
As \(x\) increases, \(y\) tends to decrease.
As \(x\) increases, \(y\) tends to stay unchanged.
\(x\) and \(y\) are unrelated.
Problem 2
Here is a scatter plot that compares hits to at bats for players on a baseball team.

Describe the relationship between the number of at bats and the number of hits using the data in the scatter plot.
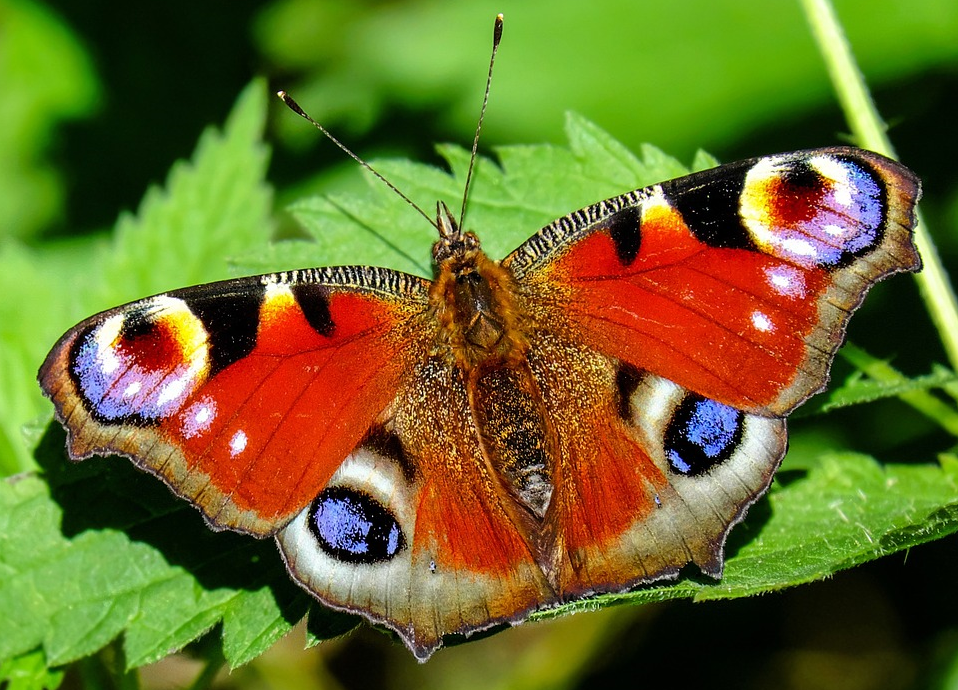
Problem 3
The linear model for some butterfly data is given by the equation \(y = 0.238x + 4.642\). Which of the following best describes the slope of the model?
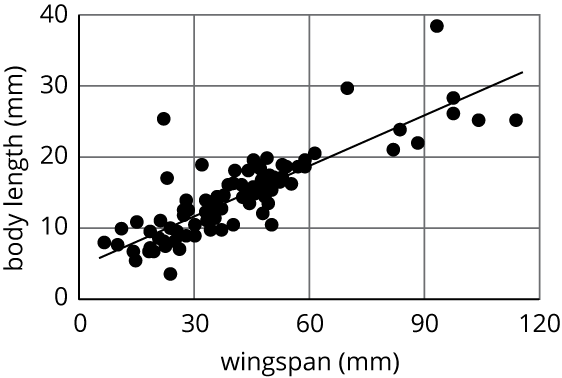
For every 1 mm the wingspan increases, the length of the butterfly increases 0.238 mm.
For every 1 mm the wingspan increases, the length of the butterfly increases 4.642 mm.
For every 1 mm the length of the butterfly increases, the wingspan increases 0.238 mm.
For every 1 mm the length of the butterfly increases, the wingspan increases 4.642 mm.
Problem 4
Solve: \(\begin{cases} y=\text-3x+13 \\ y=\text-2x+1 \\ \end{cases}\)
Problem 5
Nonstop, one-way flight times from O’Hare Airport in Chicago and prices of a one-way ticket are shown in the scatter plot.

- Circle any data that appear to be outliers.
- Use the graph to estimate the difference between any outliers and their predicted values.
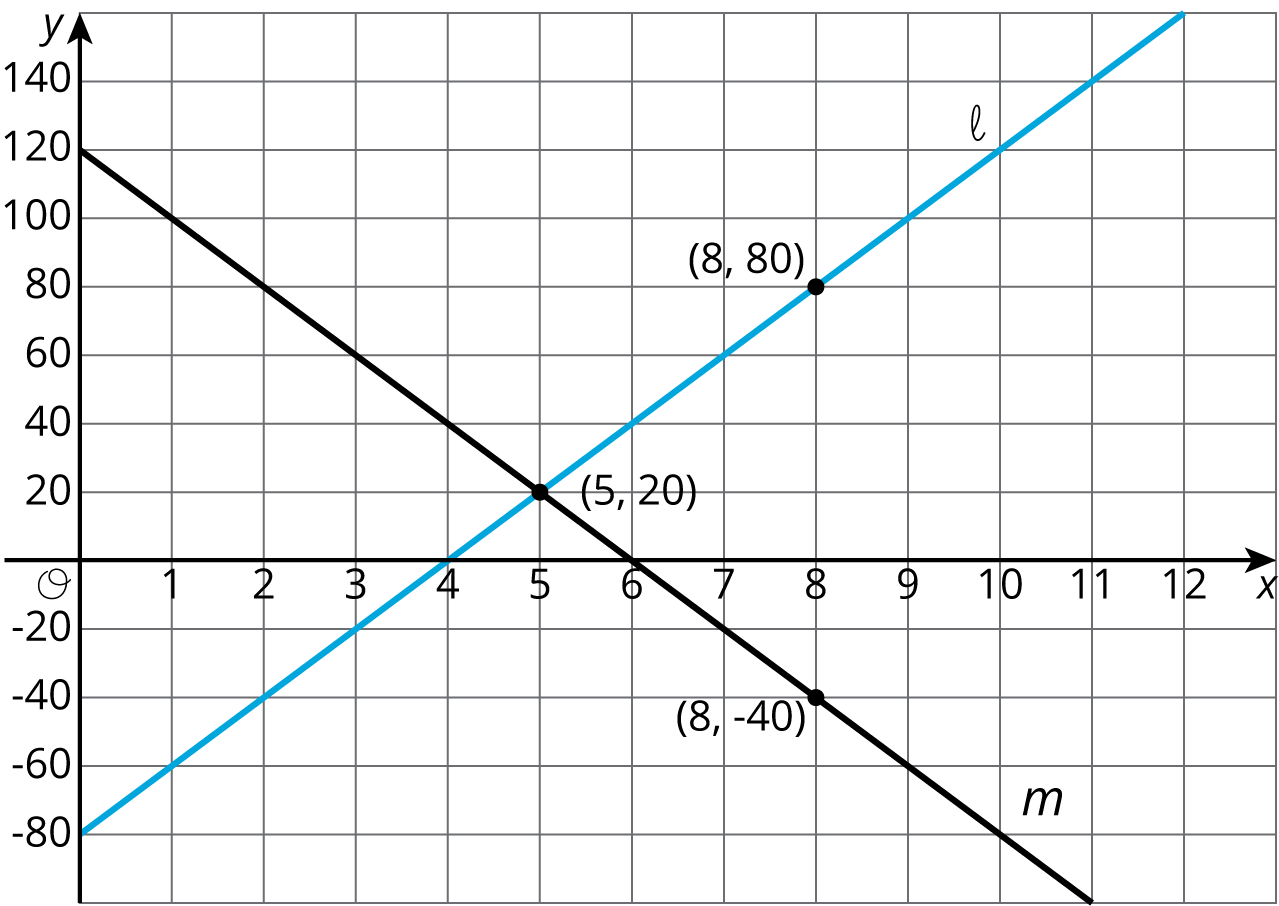
Problem 6
Consider the following graphs of linear equations. Decide which line has a positive slope, and which has a negative slope. Then calculate each line’s exact slope.