Lesson 2
Graphs of Proportional Relationships
2.1: An Unknown Situation (5 minutes)
Warm-up
In the previous warm-up, students compared different proportional relationships on two sets of axes that were scaled the same. In this warm-up, students will work with two sets of axes scaled differently and the same proportional relationship. The purpose of this warm-up is to make explicit that the same proportional relationship can appear to have different steepness depending on the axes, which is why paying attention to scale is important when making sense of graphs or making graphs from scratch. Students learned how to graph and write equations for proportional relationships in previous grades, so this warm-up also helps refresh those skills.
Identify students using different strategies to graph the relationship on the new axes. For example, since this is a proportional relationship, some students may scale up the point \((8,14)\) to something like \((40,70)\) and then plot that point before drawing a line through it and the point \((0,0)\). Other students may use the equation they wrote and one of the \(x\)-values marked on the new axes to find a point on the line and draw in the line from there.
Launch
Give 2–3 minutes of quiet work time followed by a whole-class discussion.
Student Facing
Here is a graph that could represent a variety of different situations.
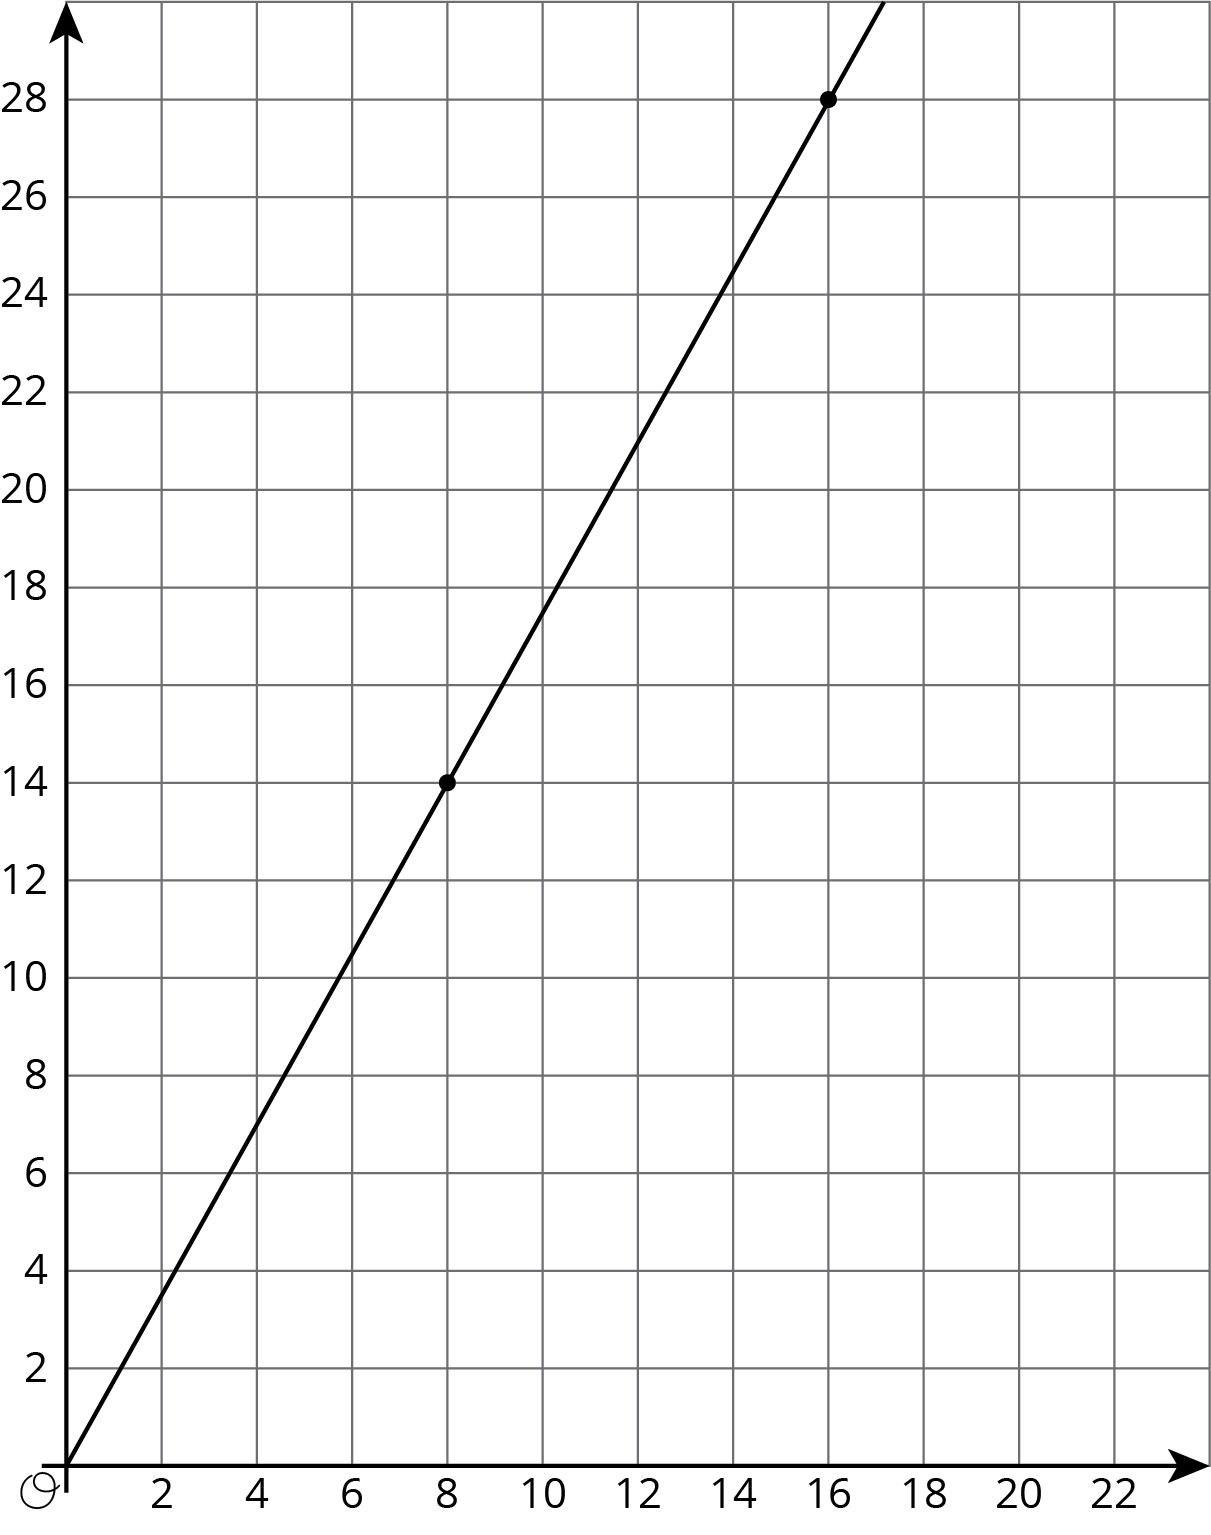
- Write an equation for the graph.
-
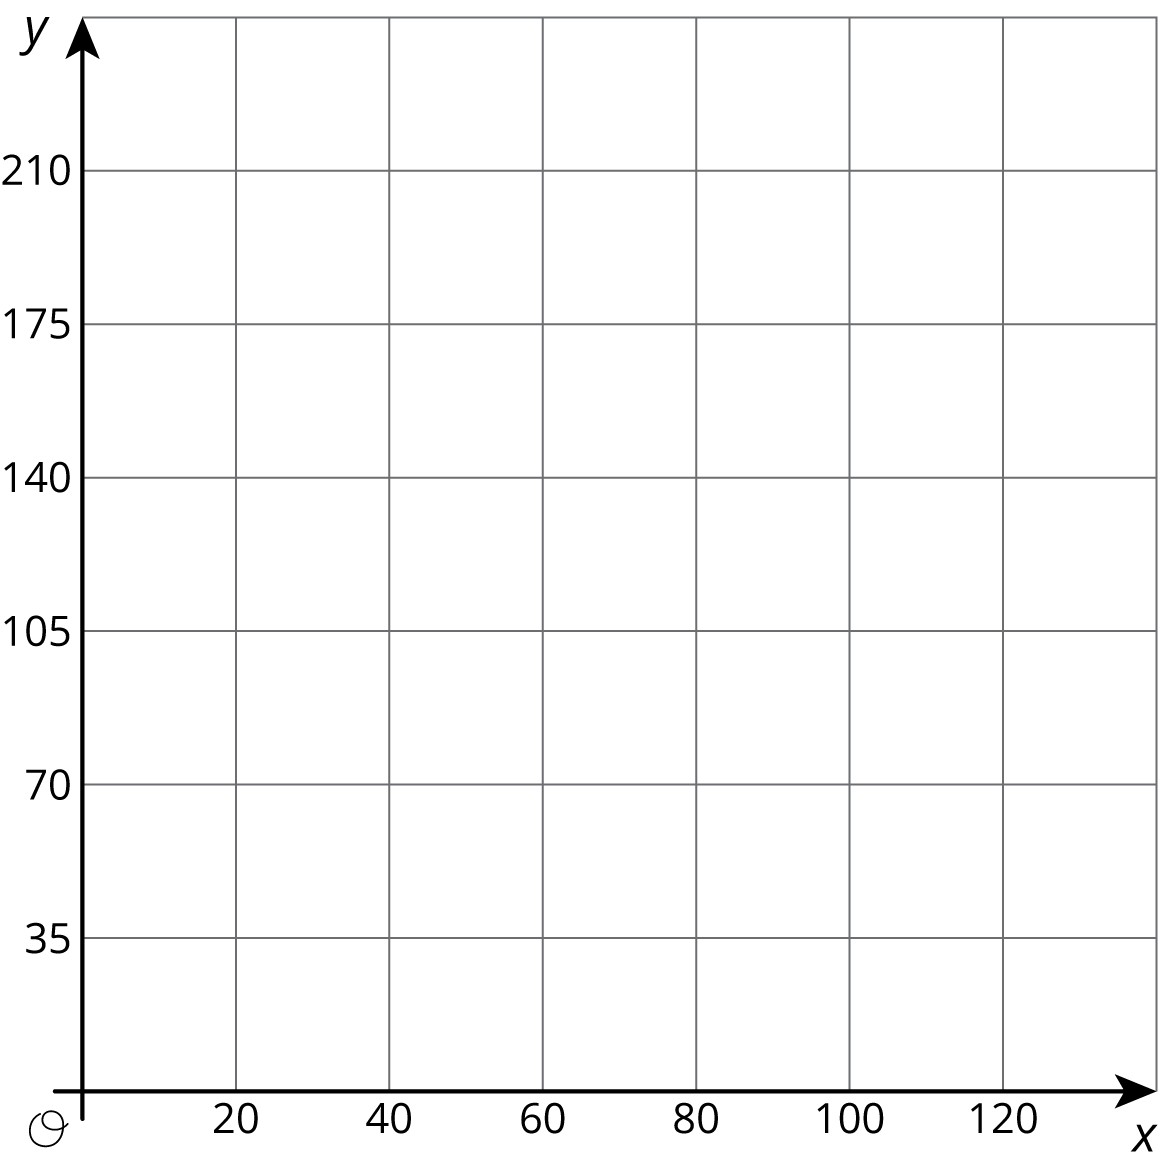
Sketch a new graph of this relationship.
Student Response
For access, consult one of our IM Certified Partners.
Activity Synthesis
Display the two images from the activity for all to see. Invite previously identified students to share how they graphed the relationship on the new line.
Ask students, “Which graph looks steeper to you?” Students may see the first line as steeper, even though the two lines have the same slope. It is important students understand that this is one of the reasons mathematics uses numbers (slope) to talk about the steepness of lines and not “looks like.”
2.2: Card Sort: Proportional Relationships (15 minutes)
Activity
The purpose of this activity is for students to identify the same proportional relationship graphed using different scales. Students will first sort the cards based on what proportional relationship they represent and then write an equation representing each relationship. Identify and select groups using different strategies to match graphs to share during the Activity Synthesis. For example, some groups may identify the unit rate for each graph in order to match while others may choose to write equations first and use those to match their graphs.
Launch
Arrange students in groups of 4. Provide each group with a set of 12 pre-cut slips.
Design Principle(s): Support sense-making; Optimize output (for explanation)
Student Facing
Your teacher will give you 12 graphs of proportional relationships.
- Sort the graphs into groups based on what proportional relationship they represent.
- Write an equation for each different proportional relationship you find.
Student Response
For access, consult one of our IM Certified Partners.
Anticipated Misconceptions
If students have trouble recalling the meaning of the constant of proportionality, remind them that one way to think about it is “the change in \(y\) for every unit change in \(x\).”
Activity Synthesis
As a result of this conversation, students should understand that the scale of the axes a graph is drawn on can hide the actual relationship between the two variables if you just look at the steepness of the line without paying attention to the numbers on the axes.
Ask previously selected groups to share their strategies for matching the graphs. Highlight uses of relevant vocabulary such as “constant of proportionality” or “unit rate.”
Have students look at Card A. Ask students, “Do you think this graph looks like \(y=\frac14x\)? Why or why not?” Possible reasons from students are:
- No, I think this graph looks like \(y=x\).
- I would expect \(y=\frac14x\) to be less steep since an increase in \(x\) means \(\frac14\) as much of an increase in \(y\).
- Since the \(x\)-scale is four times the \(y\)-scale, the line looks steeper that I expected.
Give students a moment to identify another card that they think does not “look like” the equation and select a few students to share the graph they chose and explain their thinking.
Supports accessibility for: Language; Social-emotional skills; Attention
2.3: Different Scales (15 minutes)
Activity
Building off the work in the previous activity, students now graph a proportional relationship on two differently scaled axes and compare the proportional relationship to an already-graphed non-proportional relationship on the same axes. Students are asked to make sense of the intersections of the two graphs by reasoning about the situation and consider which scale is most helpful: the zoomed in, or the zoomed out. In this case, which graph is most helpful depends on the questions asked about the situation.
Launch
Arrange students in groups of 2. Provide access to straightedges.
Reading, Writing: Math Language Routine 6 Three Reads. This is the first time Math Language Routine 6 is suggested as a support in this course. In this routine, students are supported in reading a mathematical text, situation, or word problem three times, each with a particular focus. During the first read, students focus on comprehending the situation; during the second read, students identify quantities; during the third read, the final prompt is revealed and students brainstorm possible strategies to answer the question. The intended question is withheld until the third read so students can make sense of the whole context before rushing to a solution. The purpose of this routine is to support students’ reading comprehension as they make sense of mathematical situations and information through conversation with a partner.
Design Principle(s): Support sense-making
How It Happens:
-
Use this routine to support reading comprehension of this word problem without solving it for students. In the first read, students read the problem with the goal of comprehending the situation.
Invite a student to read the problem aloud while everyone else reads with them, and then ask, “What is this situation about?” Be sure to display the two graphs or ask students to reference them while reading. Allow one minute to discuss with a partner and then share with the whole class. A typical response may be: “Two large water tanks are filling with water. One of them is filling at a constant rate, while the other is not. Both graphs represent Tank A. Tank B only has an equation.”
-
In the second read, students analyze the mathematical structure of the story by naming quantities.
Invite students to read the problem aloud with their partner, or select a different student to read to the class, and then prompt students by asking: “What can be counted or measured in this situation?” Give students one minute of quiet think time, followed by another minute to share with their partner. A typical written response may be: “liters of water in Tank A; liters of water in Tank B; amount of time that has passed in minutes; constant rate of \(\frac12\) liters per minute.”
-
In the third read, students brainstorm possible strategies to answer the questions.
Invite students to read the problem aloud with their partner, or select a different student to read to the class, and follow with the questions. Instruct students to think of ways to approach the questions without actually solving the problems.
Consider using these questions to prompt students: “How would you approach this question?”, “What strategy or method would you try first?”, and “Can you think of a different way to solve it?”.
Give students one minute of quiet think time followed by another minute to discuss with their partner. Provide these sentence frames as partners discuss: “To draw a graph for Tank B, I would….”, “One way to approach the question about finding the time when the tanks have the same amount of water would be to.…”, and “I would use the first/second graph to find....”.
-
As partners are discussing their solution strategies, select 1–2 students for each question to share their ideas with the whole class. As students are presenting their strategies to the whole class, create a display that summarizes the ideas for each question.
Listen for quantities that were mentioned during the second read, and take note of approaches in which the students distinguish between the graphs with differently-scaled axes.
-
Post the summary where all students can use it as a reference.
Student Facing
Two large water tanks are filling with water. Tank A is not filled at a constant rate, and the relationship between its volume of water and time is graphed on each set of axes. Tank B is filled at a constant rate of \(\frac12\) liters per minute. The relationship between its volume of water and time can be described by the equation \(v=\frac12t\), where \(t\) is the time in minutes and \(v\) is the total volume in liters of water in the tank.
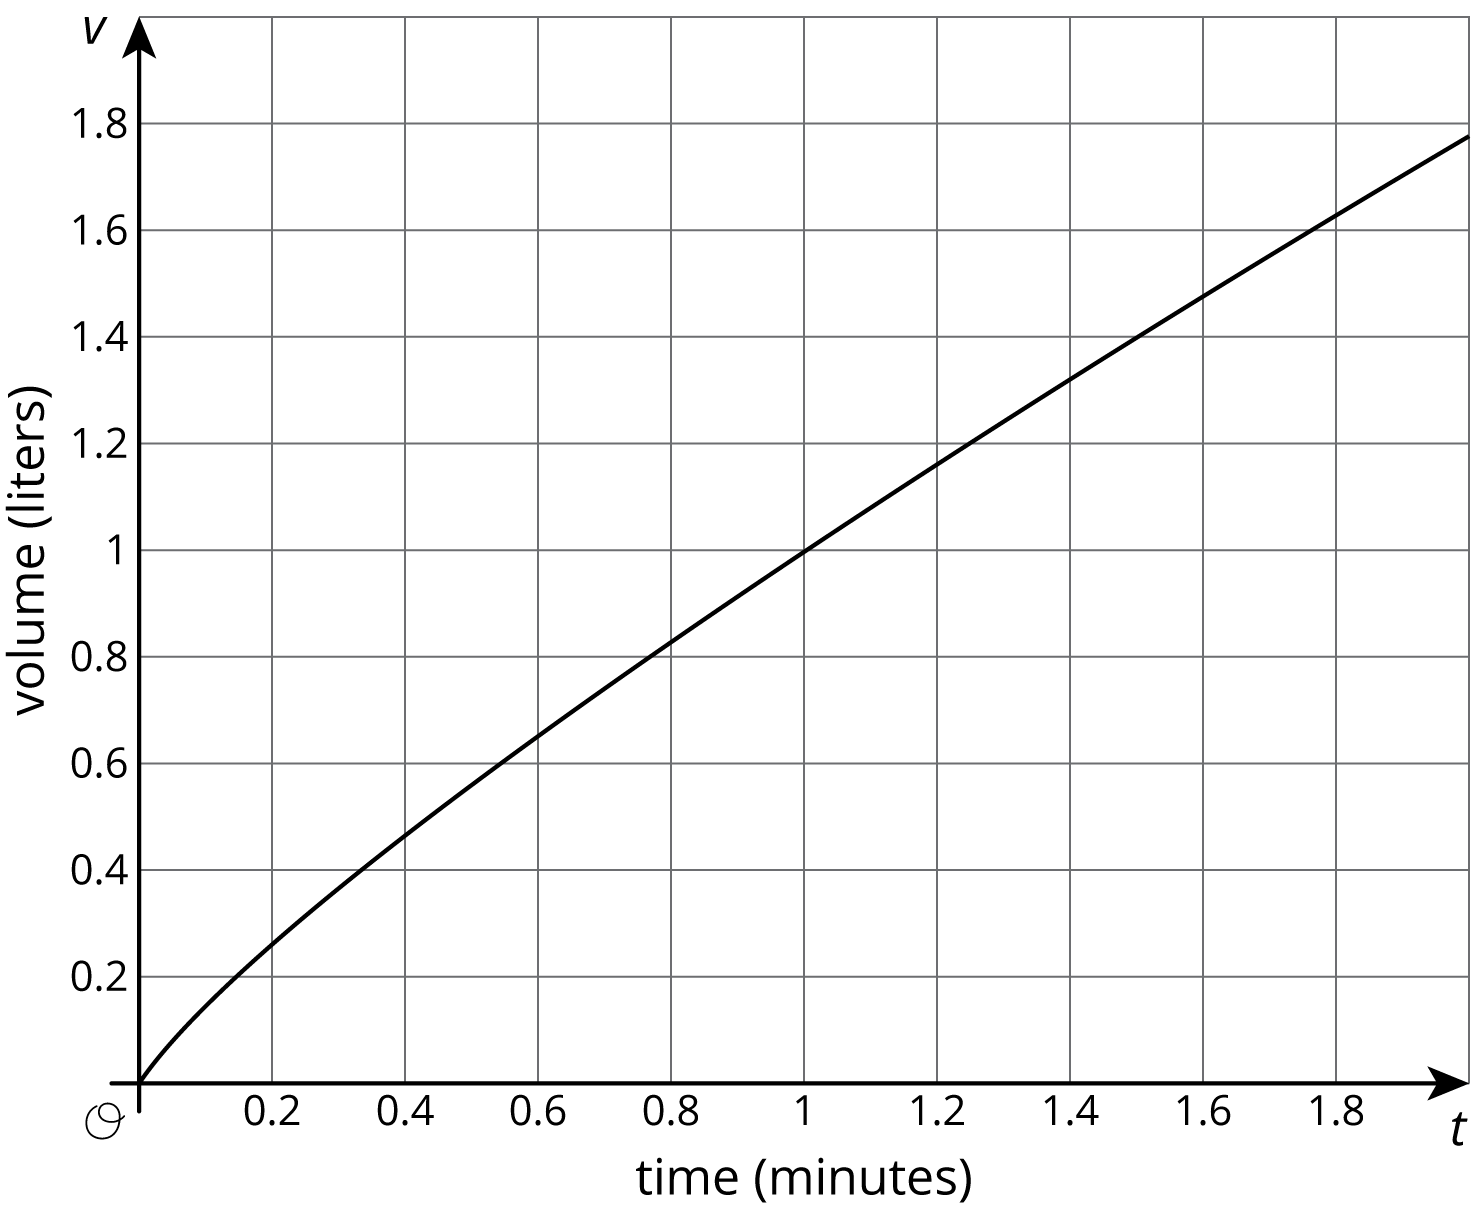
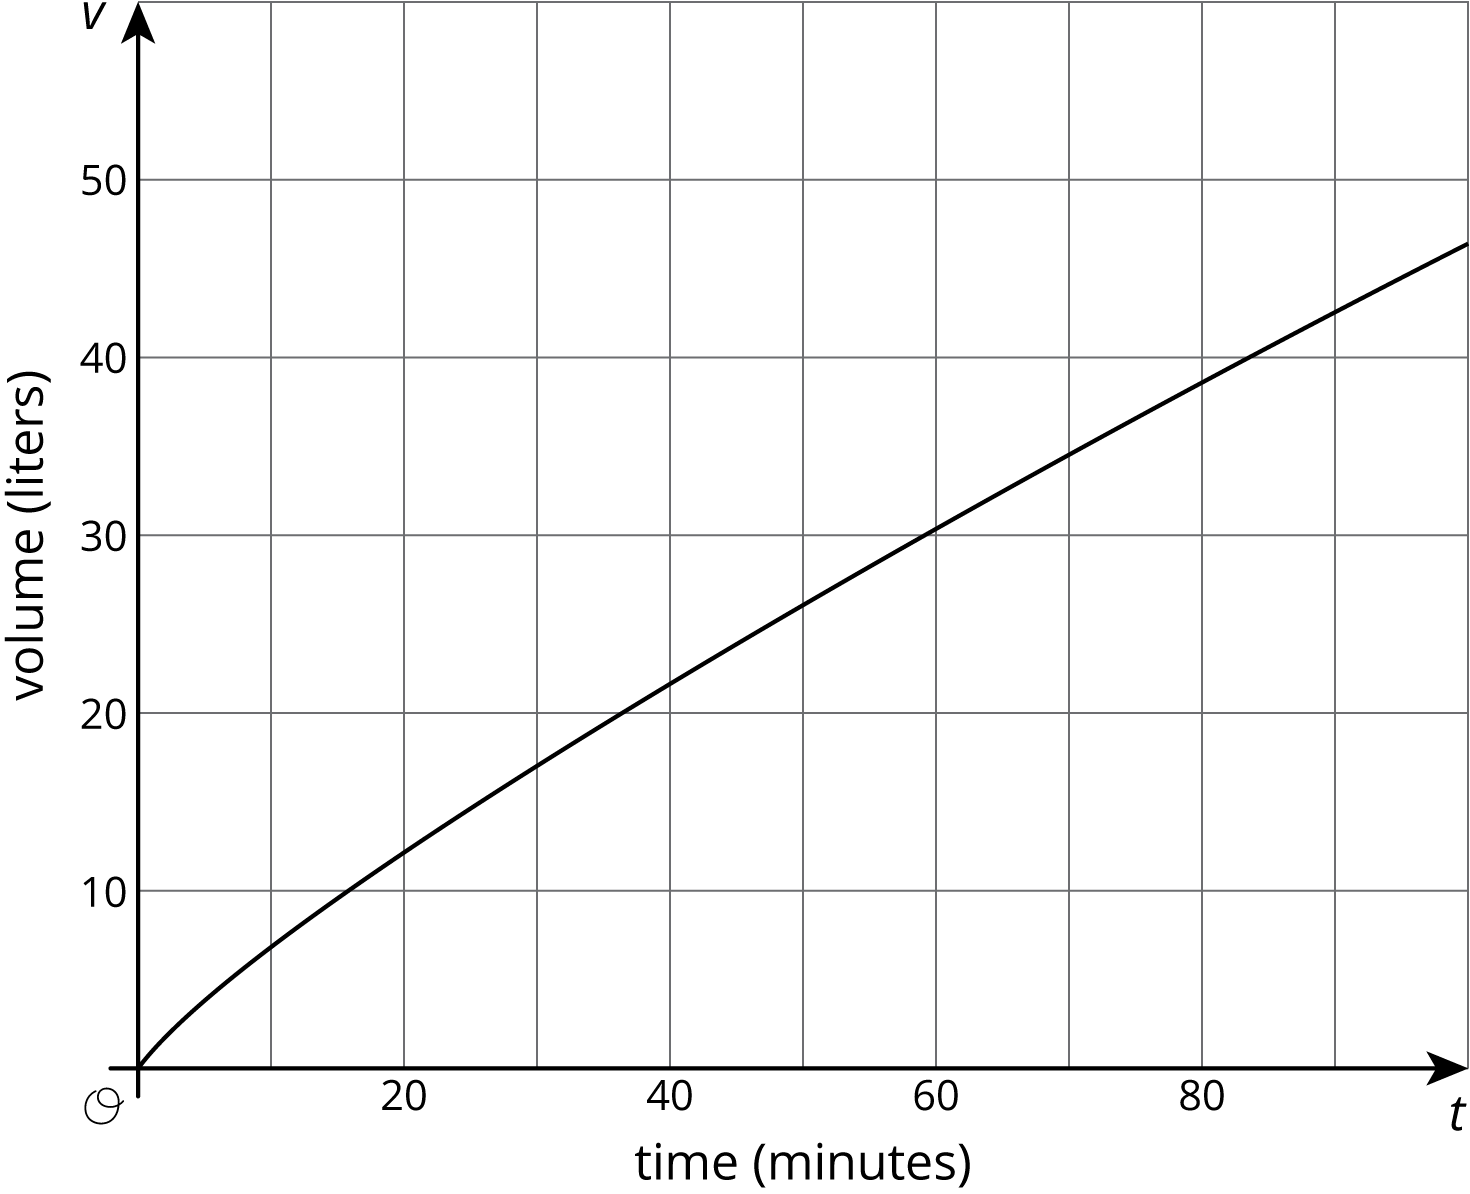
- Sketch and label a graph of the relationship between the volume of water \(v\) and time \(t\) for Tank B on each of the axes.
-
Answer the following questions and say which graph you used to find your answer.
- After 30 seconds, which tank has the most water?
- At approximately what times do both tanks have the same amount of water?
- At approximately what times do both tanks contain 1 liter of water? 20 liters?
Student Response
For access, consult one of our IM Certified Partners.
Student Facing
Are you ready for more?
A giant tortoise travels at 0.17 miles per hour and an arctic hare travels at 37 miles per hour.
- Draw separate graphs that show the relationship between time elapsed, in hours, and distance traveled, in miles, for both the tortoise and the hare.
- Would it be helpful to try to put both graphs on the same pair of axes? Why or why not?
- The tortoise and the hare start out together and after half an hour the hare stops to take a rest. How long does it take the tortoise to catch up?
Student Response
For access, consult one of our IM Certified Partners.
Activity Synthesis
Begin the discussion by asking students:
- “What question can you answer using the second graph that you can’t with the first?” (You can see when the two tanks have the same amount of water on the second graph.)
- “Is the first graph deceptive in any way?” (Yes, it looks like Tank A will always have more volume than Tank B.)
- “Which scale do you prefer?”
Tell students that if they had a situation where they needed to make a graph from scratch, it is important to check out what questions are asked. Some things to consider are:
- How large are the numbers in the problem? Do you need to go out to 10 or 100?
- What will you count by? 1s? 5s? 10s?
- Should both axes have the same scale?
In the next lessons, students will have to make these types of choices. Tell students that while it can seem like a lot of things to keep in your head, they should always remember that there are many good options when graphing a relationship so they shouldn’t feel like they have to make the same exact graph as someone else.
Lesson Synthesis
Lesson Synthesis
Display this blank graph for all to see and provide pairs of students with graph paper.
Ask pairs to draw a copy of the axis and give a signal when they have finished. (You may need to warn students to leave room on their graph paper for a second graph as sometimes students like to draw graphs that fill all the space they are given.) Invite a student to propose a proportional relationship that they consider to have a “steep” line for the class to graph on the axes.
For example, say a student proposes \(y=6x\). After students graph, add the line representing the equation to the graph on display. Then, ask students to make a second graph with the same horizontal scale, but with a vertical scale that makes \(y=6x\) not look as steep when graphed. After students have made the new graph, invite students to share and explain how they decided on their new vertical scale.
Conclude by reminding students that all these graphs of \(y=6x\) are correct since they all show a proportional relationship with a constant of proportionality equal to 6. Ask students, “Can you think of a reason we might want to graph this relationship with such a large vertical scale?” (If we needed to also graph something like \(y=60x\), we would need a pretty big vertical scale in order to see both lines.)
2.4: Cool-down - Different Axes (5 minutes)
Cool-Down
For access, consult one of our IM Certified Partners.
Student Lesson Summary
Student Facing
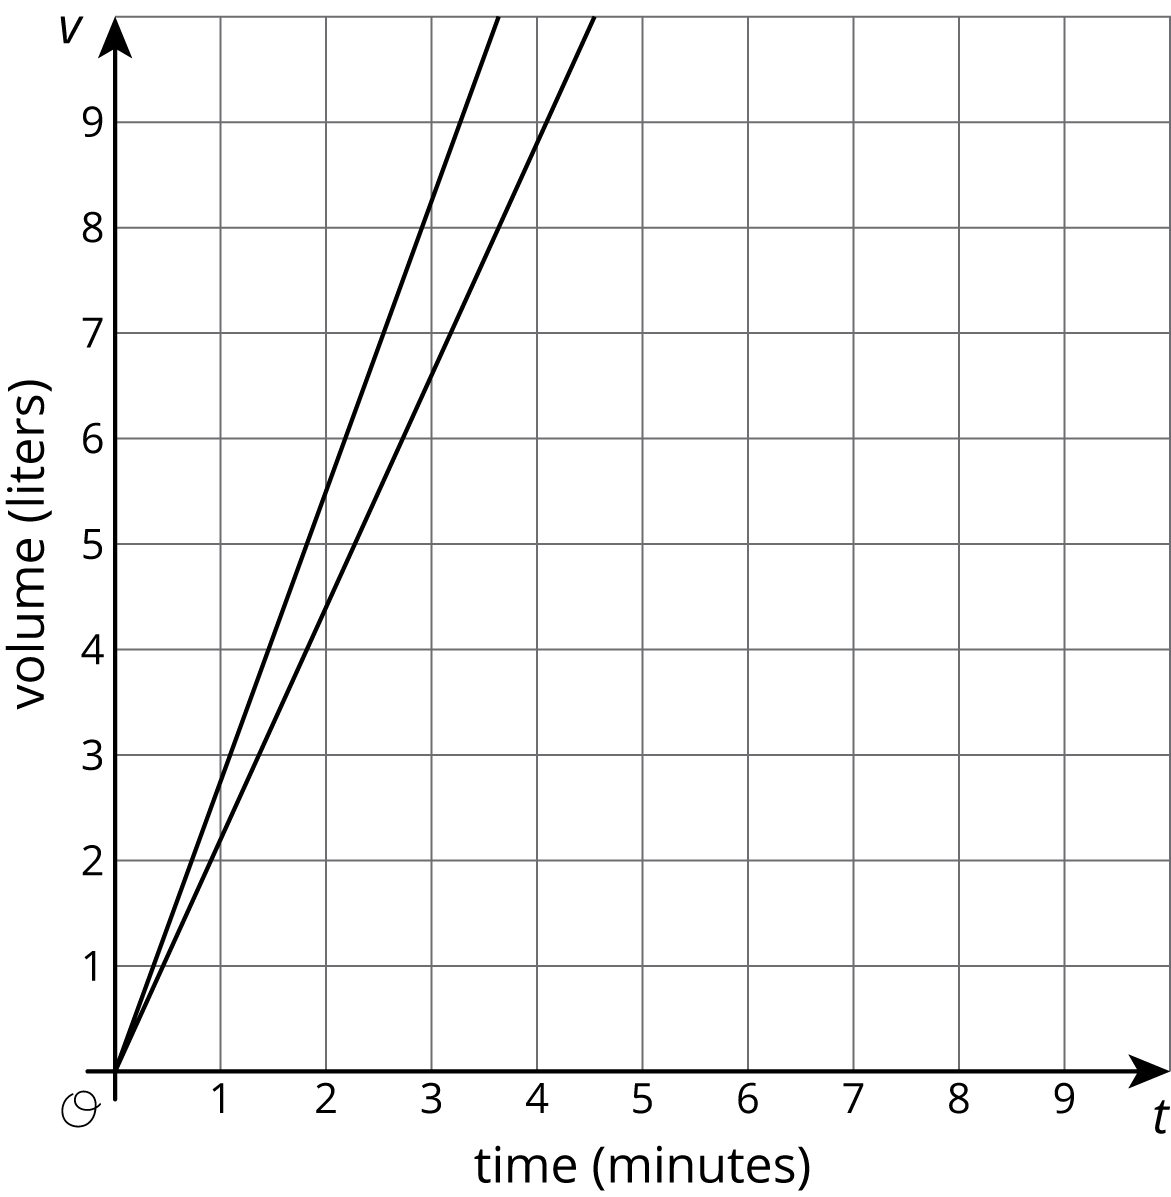
The scales we choose when graphing a relationship often depend on what information we want to know. For example, say two water tanks are filled at different constant rates. The relationship between time in minutes \(t\) and volume in liters \(v\) of tank A is given by \(v=2.2t\).
For tank B the relationship is \(v=2.75t\)
These equations tell us that tank A is being filled at a constant rate of 2.2 liters per minute and tank B is being filled at a constant rate of 2.75 liters per minute.
If we want to use graphs to see at what times the two tanks will have 110 liters of water, then using an axis scale from 0 to 10, as shown here, isn't very helpful.
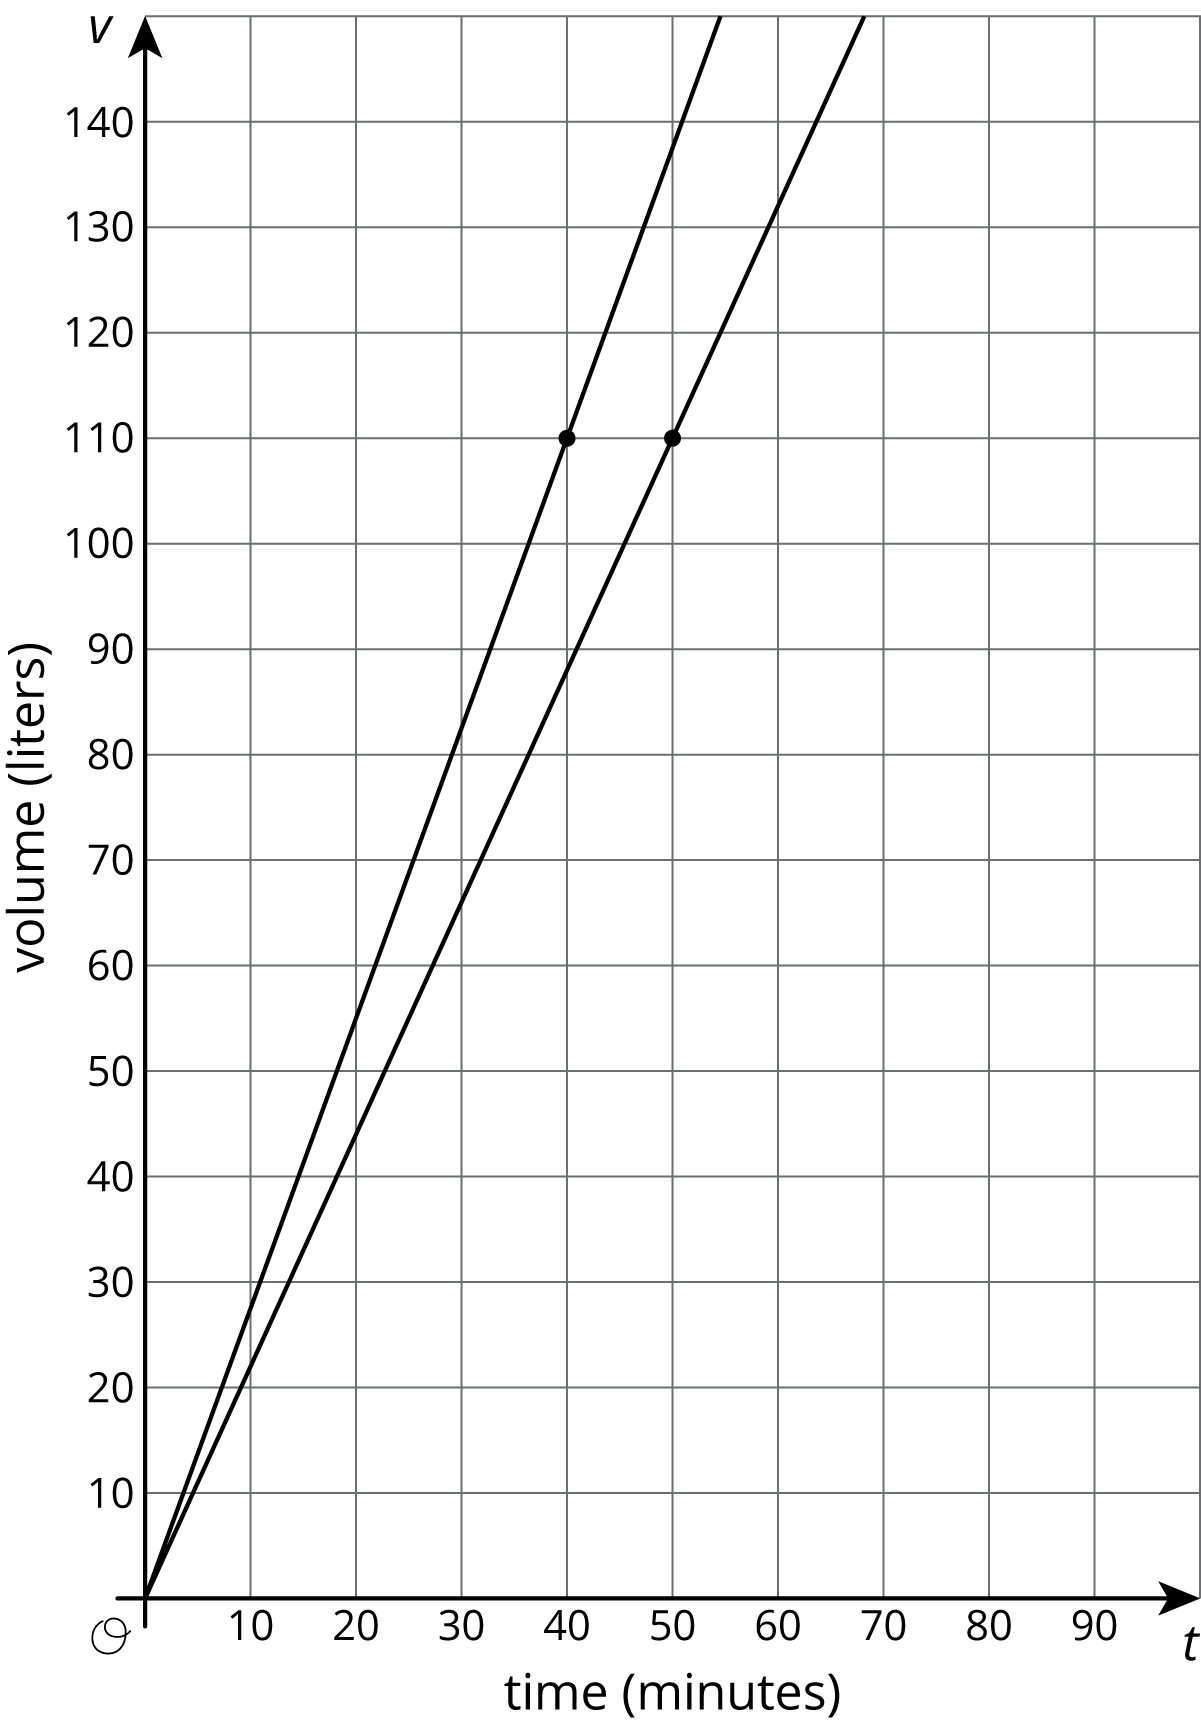
If we use a vertical scale that goes to 150 liters, a bit beyond the 110 we are looking for, and a horizontal scale that goes to 100 minutes, we get a much more useful set of axes for answering our question.
Now we can see that the two tanks will reach 110 liters 10 minutes apart—tank B after 40 minutes of filling and tank A after 50 minutes of filling.
It is important to note that both of these graphs are correct, but one uses a range of values that helps answer the question. In order to always pick a helpful scale, we should consider the situation and the questions asked about it.