Lesson 11
Equations of All Kinds of Lines
11.1: Which One Doesn’t Belong: Pairs of Lines (5 minutes)
Warm-up
This warm-up prompts students to compare four pairs of lines. It invites students to explain their reasoning and hold mathematical conversations, and allows you to hear how they use terminology and talk about lines. To allow all students to access the activity, each figure has one obvious reason it does not belong. Encourage students to find reasons based on geometric properties (e.g., only one set of lines are not parallel, only one set of lines have negative slope).
Launch
Arrange students in groups of 2–4. Display the image of the four graphs for all to see. Ask students to indicate when they have noticed one graph that does not belong and can explain why. Give students 2 minutes of quiet think time and then time to share their thinking with their group. After everyone has conferred in groups, ask the group to offer at least one reason each graph doesn’t belong.
Student Facing
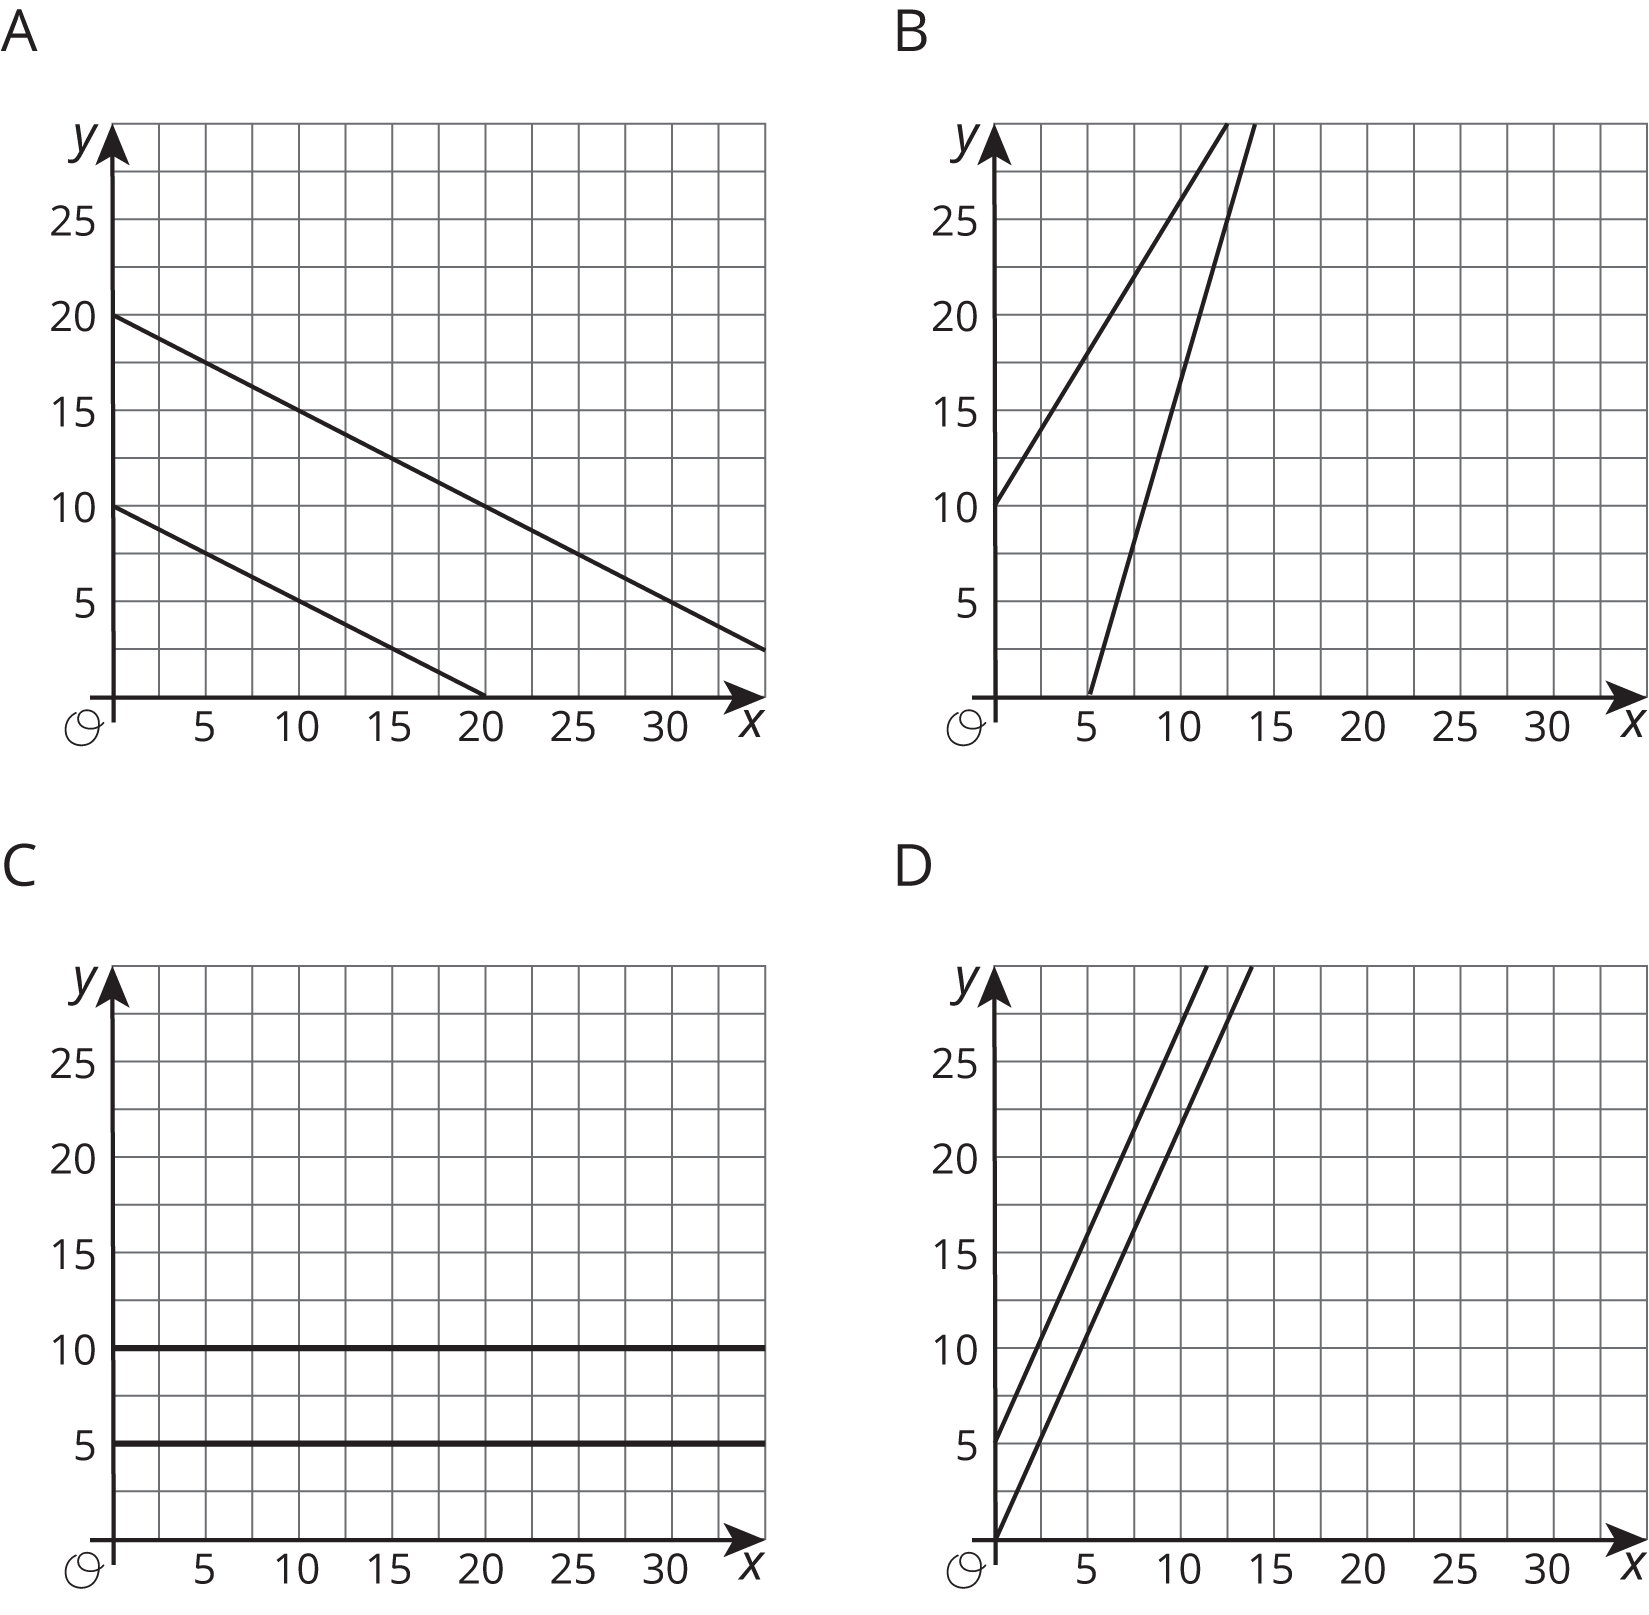
Which one doesn’t belong?
Student Response
For access, consult one of our IM Certified Partners.
Activity Synthesis
After students have conferred in groups, invite each group to share one reason why a particular pair of lines might not belong. Record and display the responses for all to see. After each response, ask the rest of the class if they agree or disagree. Since there is no single correct answer to the question asking which shape does not belong, attend to students’ explanations and ensure the reasons given are correct.
During the discussion, prompt students to explain the meaning of any terminology they use, such as parallel, intersect, origin, coordinate, ordered pair, quadrant or slope. Also, press students on claims of lines being parallel to one another. Ask students how they know they are parallel and highlight ideas about slope.
11.2: All the Same (15 minutes)
Activity
In previous lessons, students have studied lines with positive slope, negative slope, and 0 slope and have written equations for lines with positive and negative slope. In this activity, they write equations for horizontal lines (lines of slope 0) and vertical lines and they graph horizontal and vertical lines from equations. Students explain their reasoning (MP3).
Horizontal lines can be thought of as being described by equations of the form \(y = mx + b\) where \(m = 0\). In other words, a horizontal line can be thought of as a line with slope 0. Vertical lines, on the other hand, cannot be described by an equation of the form \(y = mx + b\).
Launch
Allow students quiet think time. Instruct them to pause their work after question 2 and discuss which equation makes sense and why. Tell students to resume working and pause again after question 4 for discussion. Discuss why the equations only contain one variable and what this means about the relationship between the quantities represented by \(x\) and \(y\). After students complete questions 5 and 6, ask if they can think of some real-world situations that can be represented by vertical and horizontal lines.
Supports accessibility for: Organization; Attention
Student Facing
-
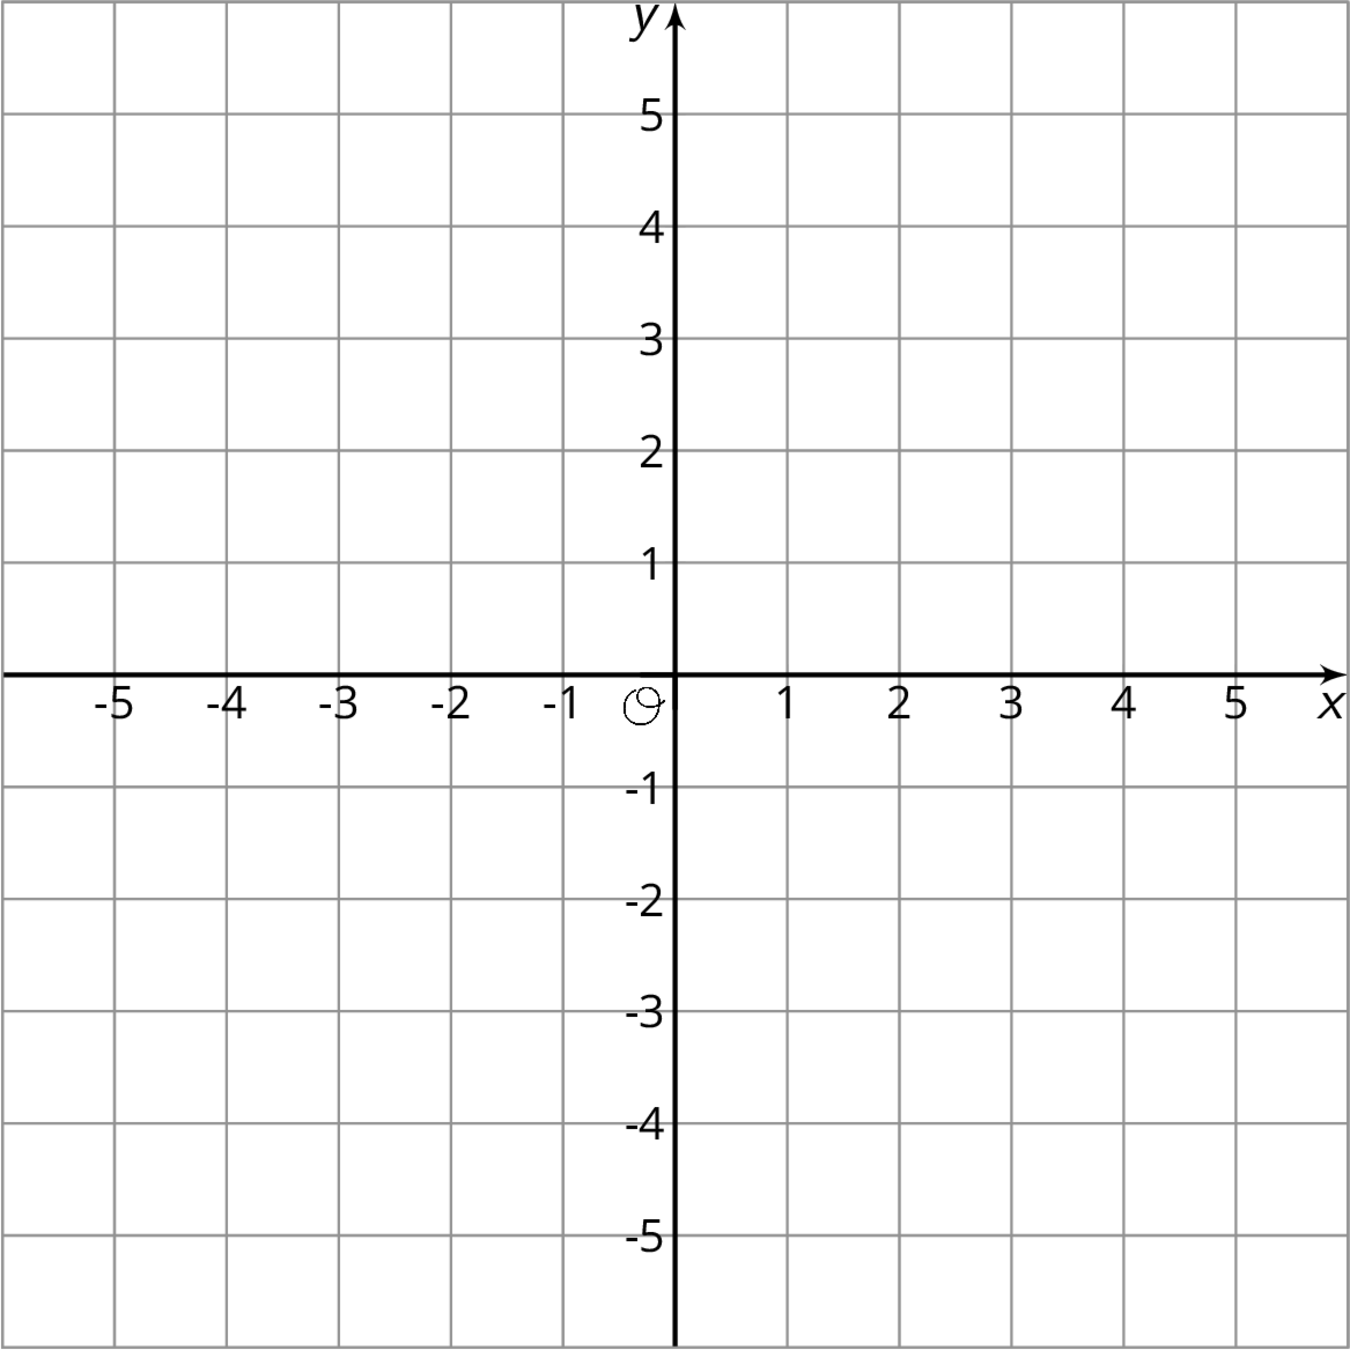
Plot at least 10 points whose \(y\)-coordinate is -4. What do you notice about them?
-
Which equation makes the most sense to represent all of the points with \(y\)-coordinate -4? Explain how you know.
\(x=\text-4\)
\(y=\text-4x\)
\(y=\text-4\)
\( x+y=\text-4\)
-
Plot at least 10 points whose \(x\)-coordinate is 3. What do you notice about them?
-
Which equation makes the most sense to represent all of the points with \(x\)-coordinate 3? Explain how you know.
\(x=3\)
\(y=3x\)
\(y=3\)
\(x+y=3\)
-
Graph the equation \(x=\text-2\).
-
Graph the equation \(y=5\).
Student Response
For access, consult one of our IM Certified Partners.
Launch
Allow students quiet think time. Instruct them to pause their work after question 2 and discuss which equation makes sense and why. Tell students to resume working and pause again after question 4 for discussion. Discuss why the equations only contain one variable and what this means about the relationship between the quantities represented by \(x\) and \(y\). After students complete questions 5 and 6, ask if they can think of some real-world situations that can be represented by vertical and horizontal lines.
Supports accessibility for: Organization; Attention
Student Facing
-
Plot at least 10 points whose \(y\)-coordinate is -4. What do you notice about them?
-
Which equation makes the most sense to represent all of the points with \(y\)-coordinate -4? Explain how you know.
\(x=\text-4\)
\(y=\text-4x\)
\(y=\text-4\)
\( x+y=\text-4\)
-
Plot at least 10 points whose \(x\)-coordinate is 3. What do you notice about them?
-
Which equation makes the most sense to represent all of the points with \(x\)-coordinate 3? Explain how you know.
\(x=3\)
\(y=3x\)
\(y=3\)
\(x+y=3\)
-
Graph the equation \(x=\text-2\).
-
Graph the equation \(y=5\).
Student Response
For access, consult one of our IM Certified Partners.
Student Facing
Are you ready for more?
- Draw the rectangle with vertices \((2,1)\), \((5,1)\), \((5,3)\), \((2,3)\).
- For each of the four sides of the rectangle, write an equation for a line containing the side.
- A rectangle has sides on the graphs of \(x = \text-1\), \(x = 3\), \(y = \text-1\), \(y = 1\). Find the coordinates of each vertex.
Student Response
For access, consult one of our IM Certified Partners.
Activity Synthesis
In order to highlight the structure of equations of vertical and horizontal lines, ask students:
- "Why does the equation for the points with \(y\)-coordinate -4 not contain the variable \(x\)?" (\(x\) can take any value while \(y\) is always -4. The only constraint is on \(y\) and there is no dependence of \(x\) on \(y\).)
- "Why does the equation for the points with \(x\)-coordinate 3 not contain the variable \(y\)?" (\(y\) can take any value while \(x\) is always 3. The only constraint is on \(x\) and there is no dependence of \(y\) on \(x\).)
- "What does this say about the relationship between the quantities represented by \(x\) and \(y\) in these situations?" (Changes in one do not affect the other. One is not dependent on the other. They don’t change together according to a formula.)
- "What would be some real-world examples of situations that could be represented by these types of equations?" (Examples: You pay the same fee regardless of your age; bus tickets cost the same no matter how far you travel; you remain the same distance from home as the hours pass during the school day.)
Design Principle(s): Support sense-making; Maximize meta-awareness
11.3: Same Perimeter (15 minutes)
Activity
In this activity, students analyze a line and an equation defining the line in a geometric context. Students find pairs of numbers for the width and length of rectangles that all have the same perimeter. Next, they draw some of the rectangles with a vertex at the origin in the coordinate plane, and discover that the set of opposite vertices lie on a line. Finally, they write an equation for the line and consider how the slope of the line relates to the changing lengths and widths of the rectangles.
Identify students who come up with different equations for the line. An equation of the form \(2\ell + 2w = 50\), where \(\ell\) is the length of the rectangle and \(w\) is its width, is natural if they are thinking about the context, namely, that the perimeter of the rectangle is 50 units. In fact, students have likely seen this equation in this context in grade 6. On the other hand, students who follow the steps in the task and draw the line connecting the rectangle vertices are likely to write an equation in the form \(w = 25 - \ell\) (or perhaps \(2w = 50 - 2\ell\)) because the \(w\)-intercept of the graph is 25 and its slope is -1. Invite students who wrote these different forms for an equation to present during the discussion.
Launch
Ask students to sketch a rectangle whose perimeter is 50 units and label the lengths of its sides. After giving them a minute to come up with their rectangle, ask them to share some of the lengths and widths they found. Examples might be 10 and 15, 5 and 20, or 1 and 24. Then demonstrate with a 50-cm long string with its ends tied together that a given perimeter can yield several different rectangles by varying the width and length. Ensure that everyone understands that rectangles have 4 sides, that rectangles have two pairs of congruent sides, and that there is more than one rectangle whose perimeter is 50 units.
Supports accessibility for: Memory; Language
Student Facing
-
There are many possible rectangles whose perimeter is 50 units. Complete the table with lengths, \(\ell\), and widths, \(w\), of at least 10 such rectangles.
\(\ell\) \(w\) -
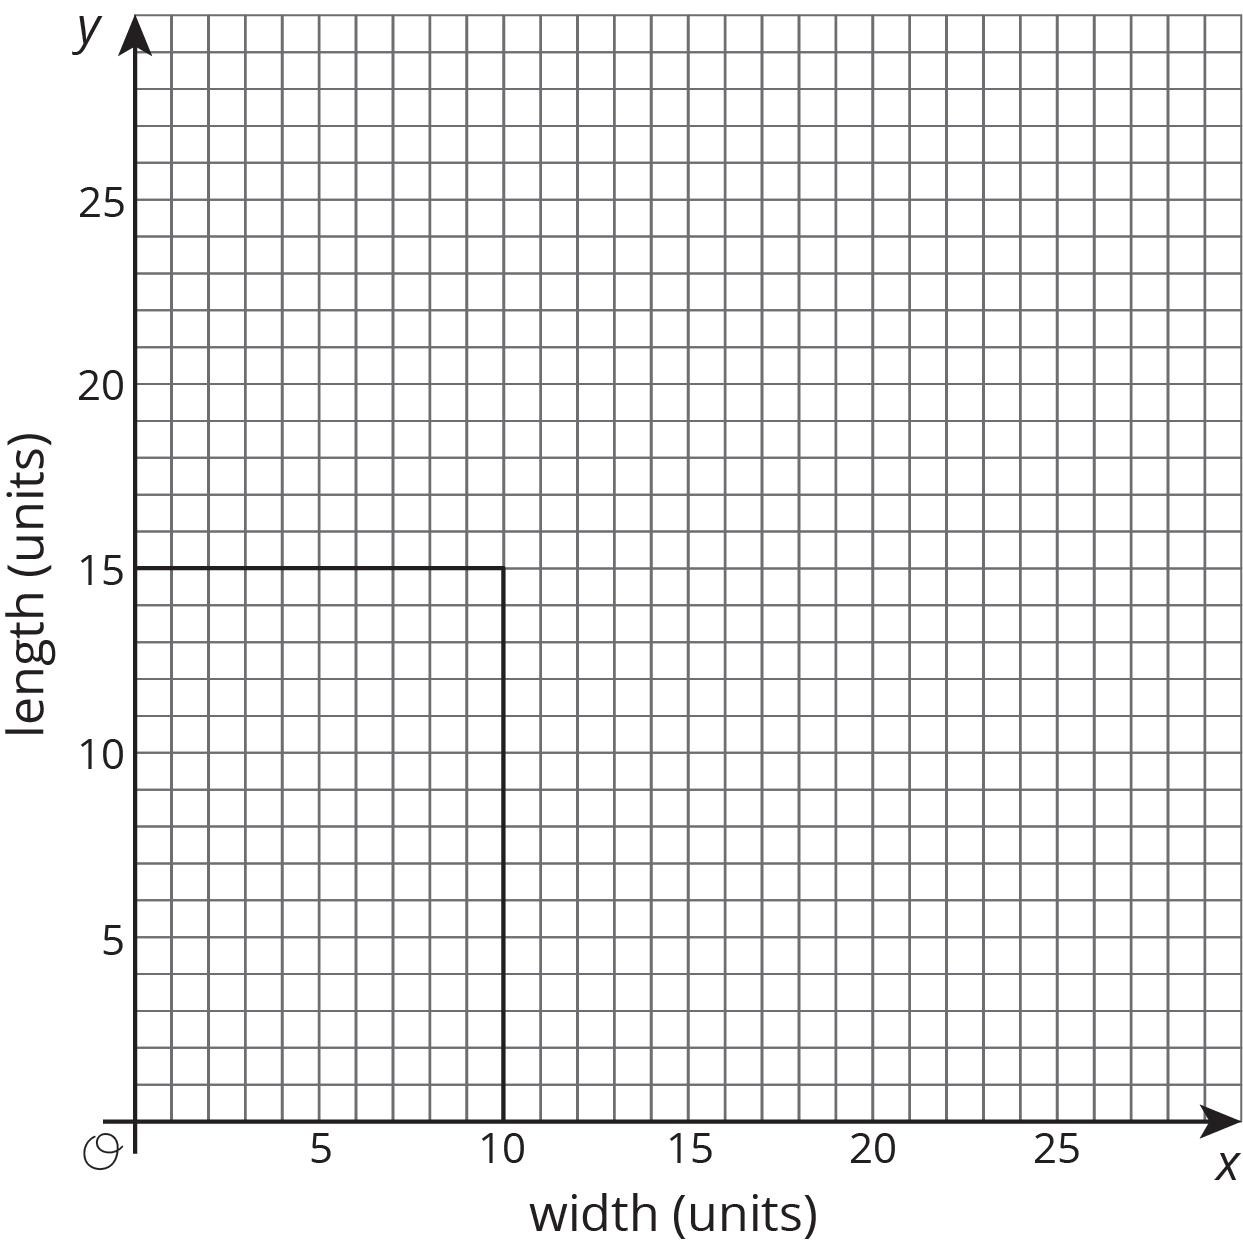
The graph shows one rectangle whose perimeter is 50 units, and has its lower left vertex at the origin and two sides on the axes. On the same graph, draw more rectangles with perimeter 50 units using the values from your table. Make sure that each rectangle has a lower left vertex at the origin and two sides on the axes.
-
Each rectangle has a vertex that lies in the first quadrant. These vertices lie on a line. Draw in this line, and write an equation for it.
-
What is the the slope of this line? How does the slope describe how the width changes as the length changes (or vice versa)?
Student Response
For access, consult one of our IM Certified Partners.
Launch
Ask students to sketch a rectangle whose perimeter is 50 units and label the lengths of its sides. After giving them a minute to come up with their rectangle, ask them to share some of the lengths and widths they found. Examples might be 10 and 15, 5 and 20, or 1 and 24. Then demonstrate with a 50-cm long string with its ends tied together that a given perimeter can yield several different rectangles by varying the width and length. Ensure that everyone understands that rectangles have 4 sides, that rectangles have two pairs of congruent sides, and that there is more than one rectangle whose perimeter is 50 units.
Supports accessibility for: Memory; Language
Student Facing
-
There are many possible rectangles whose perimeter is 50 units. Complete the table with lengths, \(\ell\), and widths, \(w\), of at least 10 such rectangles.
\(\ell\) \(w\) -
The graph shows one rectangle whose perimeter is 50 units, and has its lower left vertex at the origin and two sides on the axes.
On the same graph, draw more rectangles with perimeter 50 units using the values from your table. Make sure that each rectangle has a lower left vertex at the origin and two sides on the axes.
-
Each rectangle has a vertex that lies in the first quadrant. These vertices lie on a line. Draw in this line and write an equation for it.
-
What is the the slope of this line? How does the slope describe how the width changes as the length changes (or vice versa)?
Student Response
For access, consult one of our IM Certified Partners.
Activity Synthesis
Invite students who write \(2\ell + 2w = 50\) for an equation of the line to share their response (if no one has written this equation for the third question, ask students if it is correct). This equation has the advantage of directly modeling the context: the perimeter of a rectangle is \(2\ell + 2w\), so if the perimeter is 50, then \(2\ell + 2w = 50\). An additional advantage to this form of the equation is that every line, including horizontal and vertical lines, can be written in this form: \(\ell = 5\) is an equation for a horizontal line while \(w = 3\) is an equation for a vertical line.
Invite students who write \(\ell = 25- w\) (or some variant) to share. This equation is not apparent from the scenario, but it reveals a few interesting aspects of the problem:
- The rectangle has to have length less than 25 (since the width has to be positive)
- For each unit the length increases, the width decreases by one unit (in order to balance out when the sides of the rectangle are added to get the perimeter)
Ask students if the lengths and widths need to be whole numbers. In the next two lessons, students will encounter equations where the contexts determine what values the variables can take on. If students agree that the lengths and widths can take on any measurable value, ask how many different rectangles can be drawn. Practically speaking, the number is limited by what we can measure and draw with reasonable precision, while in theory, there are an infinite number of rectangles with perimeter 50.
Design Principle(s): Maximize meta-awareness; Support sense-making
Lesson Synthesis
Lesson Synthesis
Students have spent considerable time in the 7th and 8th grades solving problems with proportional relationships and non-proportional relationships that can be represented by equations and graphs with positive slopes. Ask students to now consider real-world situations where slopes are not positive.
Ask students, "how can you tell from a real-world situation that the graph of the equation that represents it will be a horizontal line? Be a vertical line? Have a negative slope?"
For horizontal and vertical lines, the key feature is that one of the two variables does not vary while the other one can take any value. In the \(x\)-\(y\) plane, when the variable \(x\) can take any value, it is a vertical line, and when the variable \(y\) can take any value, it is a horizontal line.
11.4: Cool-down - Line Design (5 minutes)
Cool-Down
For access, consult one of our IM Certified Partners.
Student Lesson Summary
Student Facing
Horizontal lines in the coordinate plane represent situations where the \(y\) value doesn’t change at all while the \(x\) value changes. For example, the horizontal line that goes through the point \((0,13)\) can be described in words as “for all points on the line, the \(y\) value is always 13.” An equation that says the same thing is \(y=13\).
Vertical lines represent situations where the \(x\) value doesn’t change at all while the \(y\) value changes. The equation \(x=\text-4\) describes a vertical line through the point \((\text-4,0)\).