Lesson 8
Analyzing Bivariate Data
Let’s analyze data like a pro.
Problem 1
Different stores across the country sell a book for different prices. The table shows the price of the book in dollars and the number of books sold at that price.
| price in dollars | number sold |
|---|---|
| 11.25 | 53 |
| 10.50 | 60 |
| 12.10 | 30 |
| 8.45 | 81 |
| 9.25 | 70 |
| 9.75 | 80 |
| 7.25 | 120 |
| 12 | 37 |
| 9.99 | 130 |
| 7.99 | 100 |
| 8.75 | 90 |
- Draw a scatter plot of this data. Label the axes.
- Are there any outliers? Explain your reasoning.
- If there is a relationship between the variables, explain what it is.
- Remove any outliers, and draw a line that you think is a good fit for the data.
Problem 2
Here is a scatter plot:
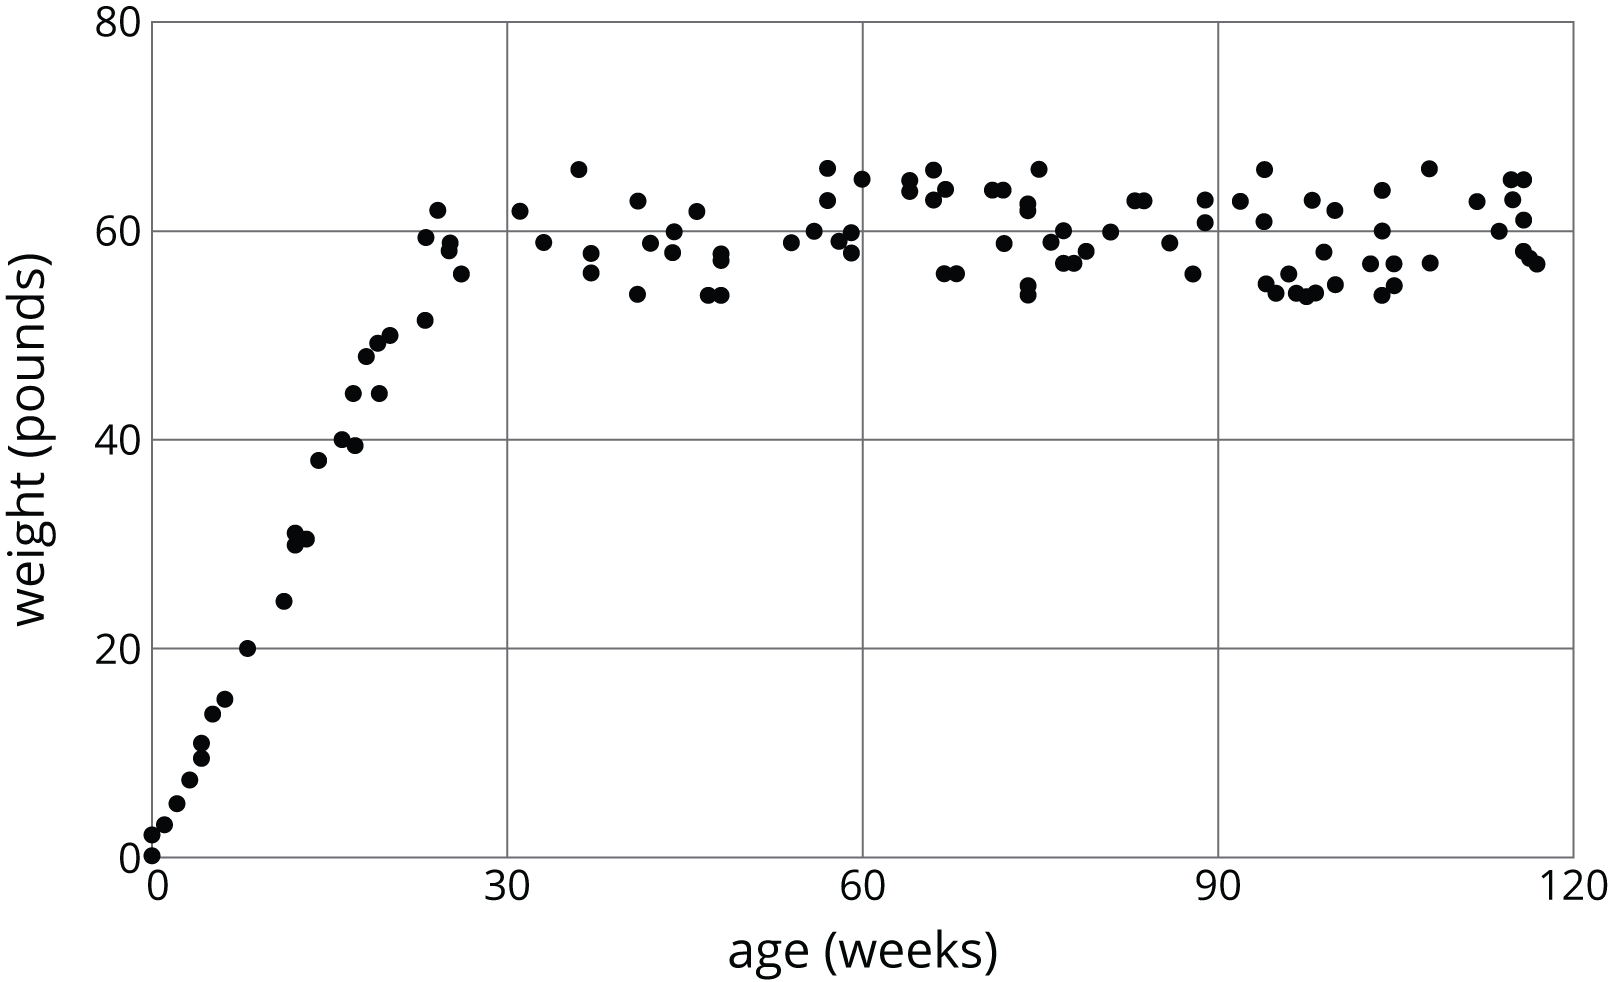
Select all the following that describe the association in the scatter plot:
A:
Linear association
B:
Non-linear association
C:
Positive association
D:
Negative association
E:
(From Unit 6, Lesson 7.)
No association
Problem 3
Using the data in the scatter plot, what can you tell about the slope of a good model?

A:
The slope is positive.
B:
The slope is zero.
C:
The slope is negative.
D:
(From Unit 6, Lesson 6.)
There is no association.