Lesson 7
Observing More Patterns in Scatter Plots
Let's look for other patterns in data.
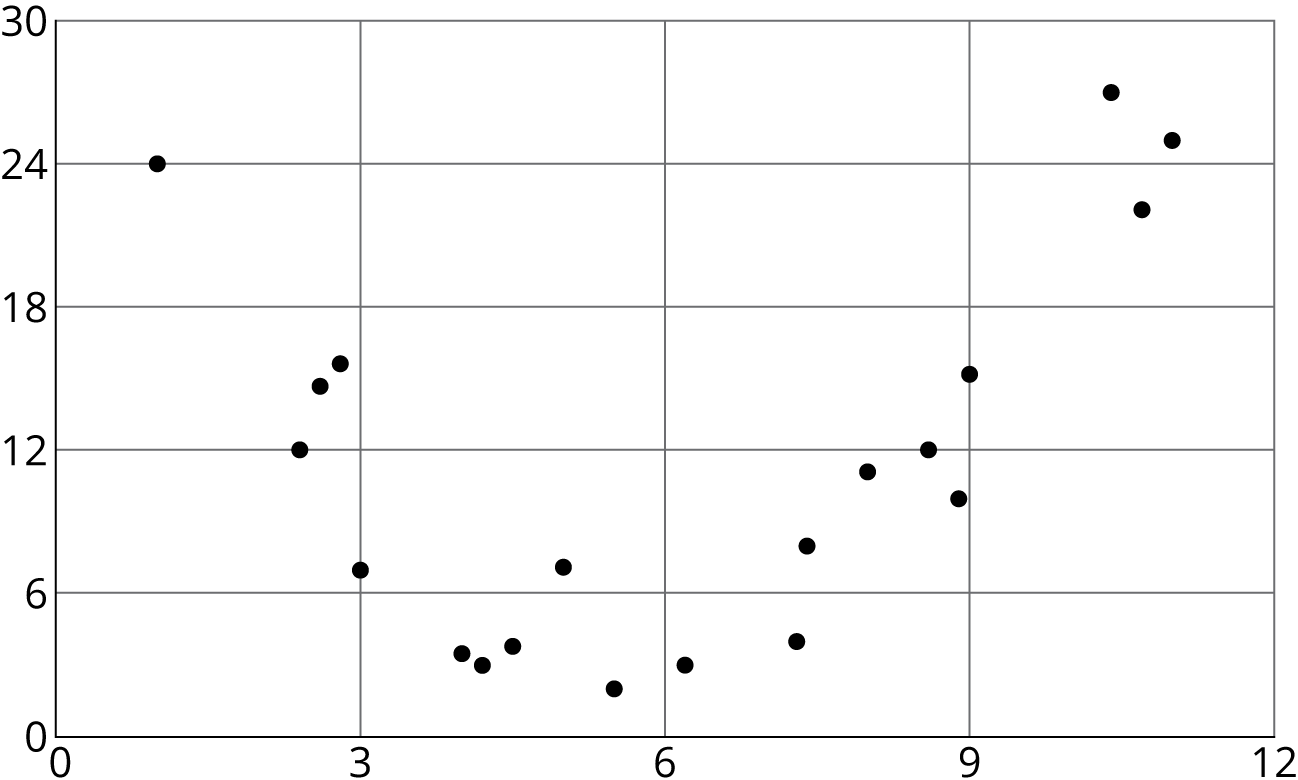
7.1: Notice and Wonder: Nonlinear Scatter Plot
What do you notice? What do you wonder?
7.2: Scatter Plot City
Your teacher will give you a set of cards. Each card shows a scatter plot.
- Sort the cards into categories and describe each category.
- Explain the reasoning behind your categories to your partner. Listen to your partner’s reasoning for their categories.
- Sort the cards into two categories: positive associations and negative associations. Compare your sorting with your partner’s and discuss any disagreements.
- Sort the cards into two categories: linear associations and non-linear associations. Compare your sorting with your partner’s and discuss any disagreements.
7.3: Clustering
How are these scatter plots alike? How are they different?
Summary
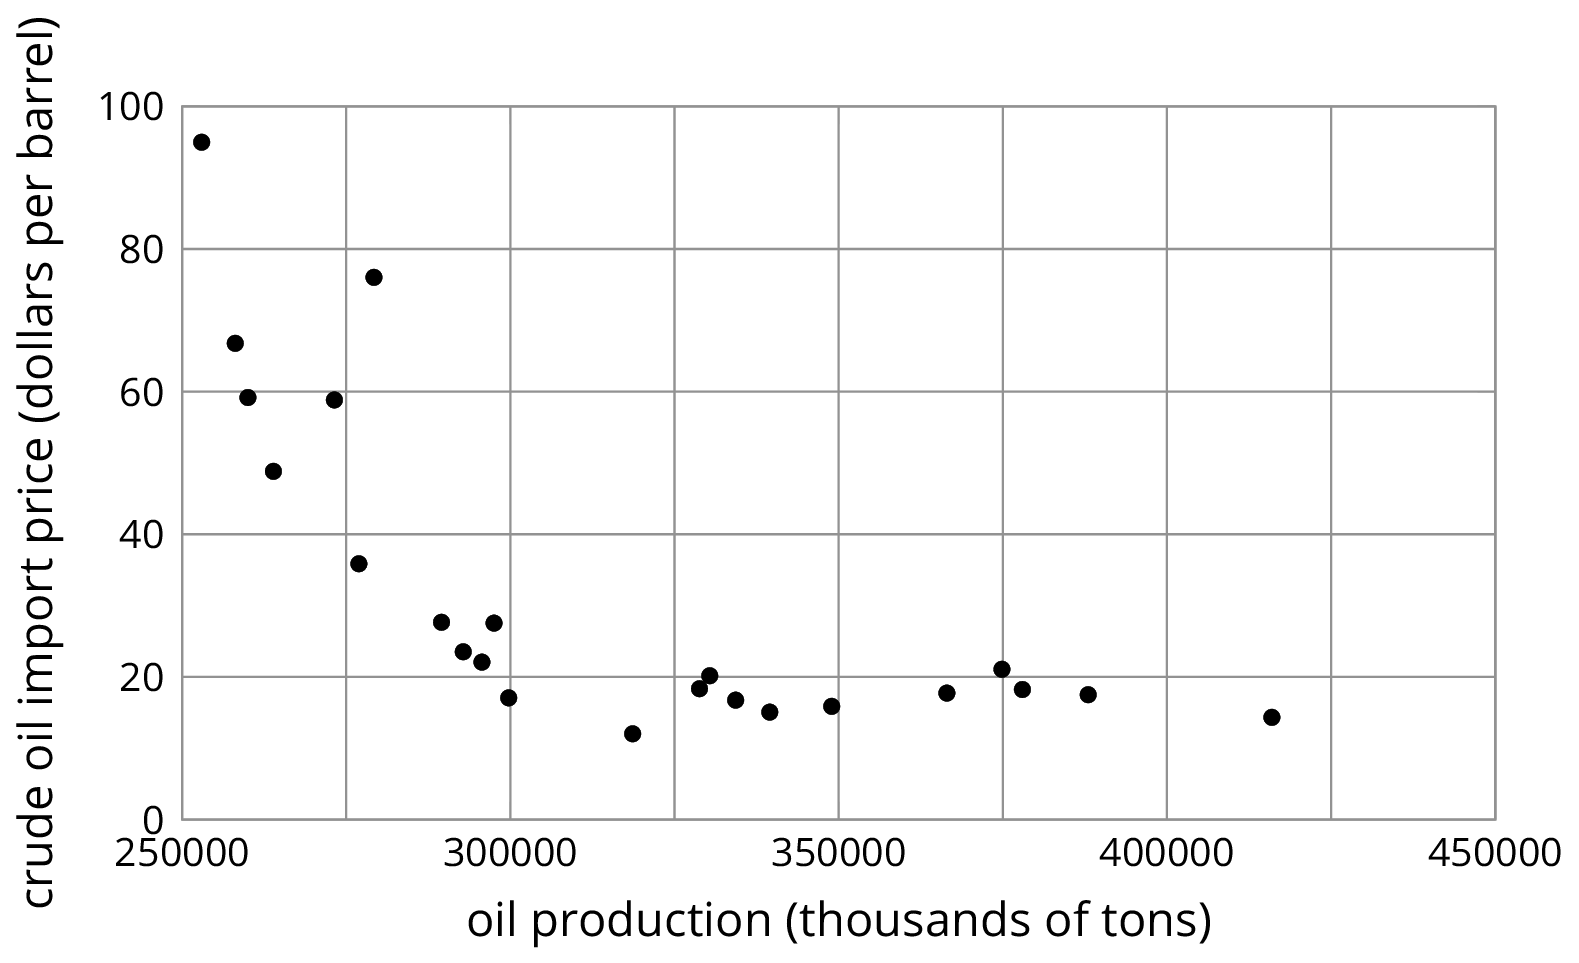
Sometimes a scatter plot shows an association that is not linear:
We call such an association a non-linear association. In later grades, you will study functions that can be models for non-linear associations.
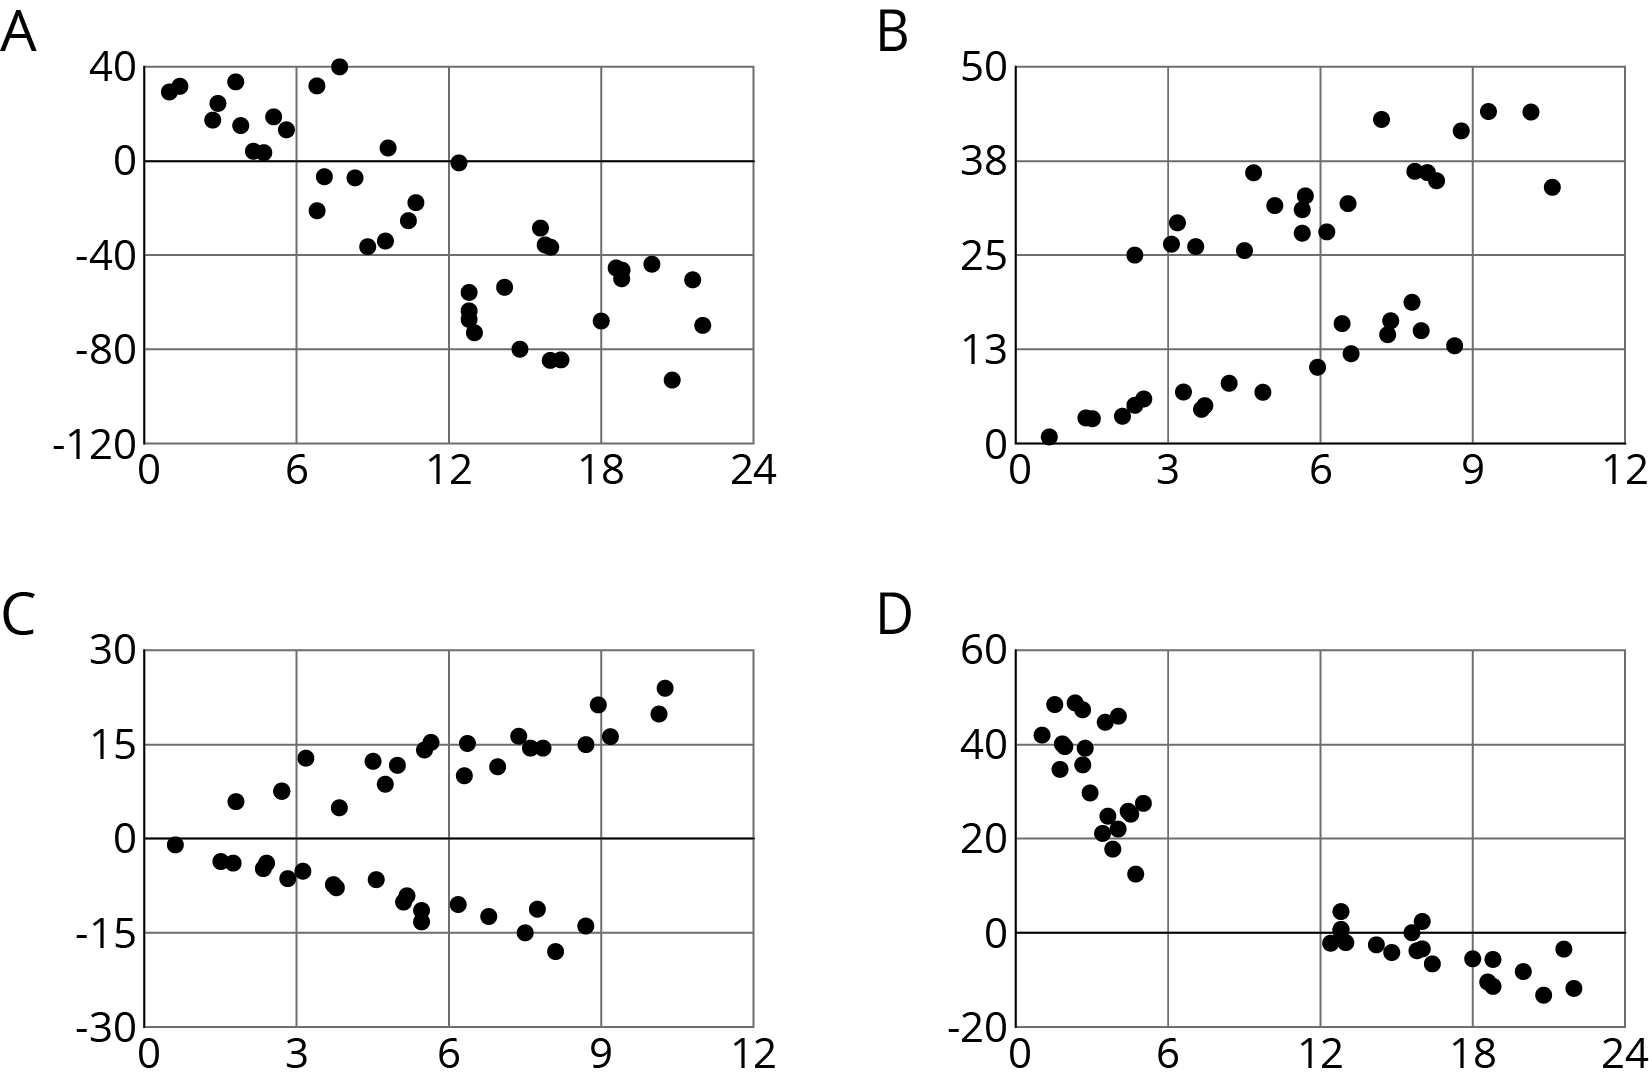
Sometimes in a scatter plot we can see separate groups of points.
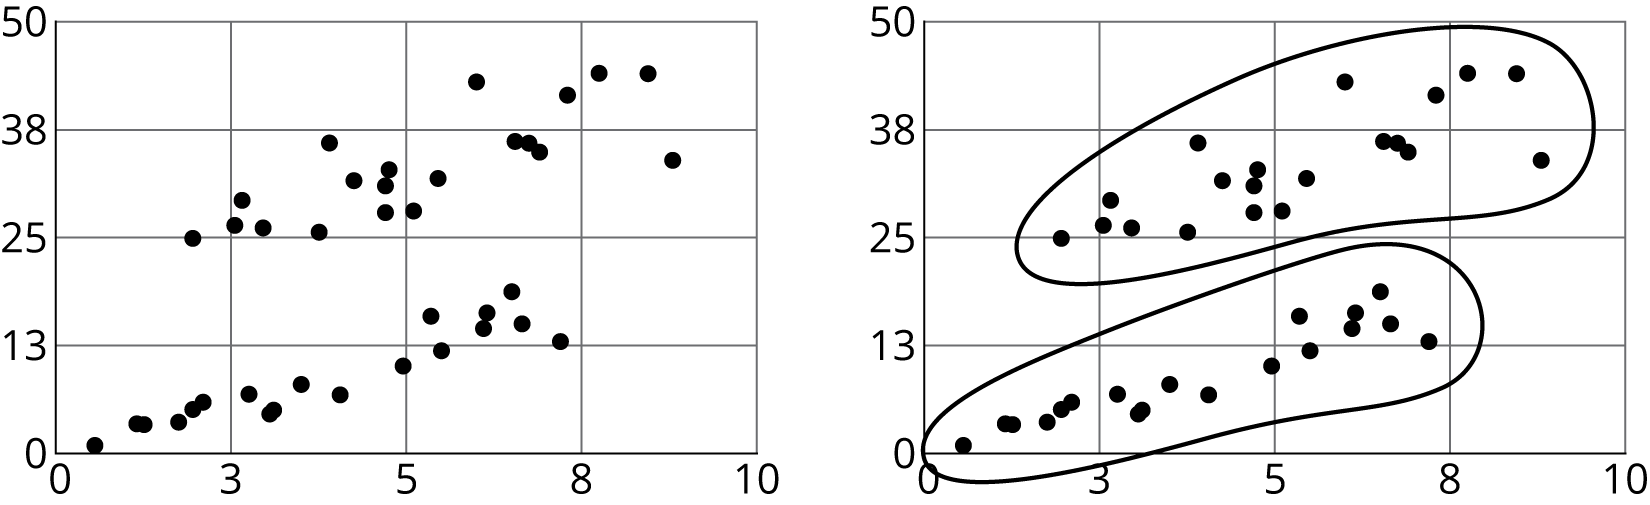
We call these groups clusters.
Glossary Entries
- negative association
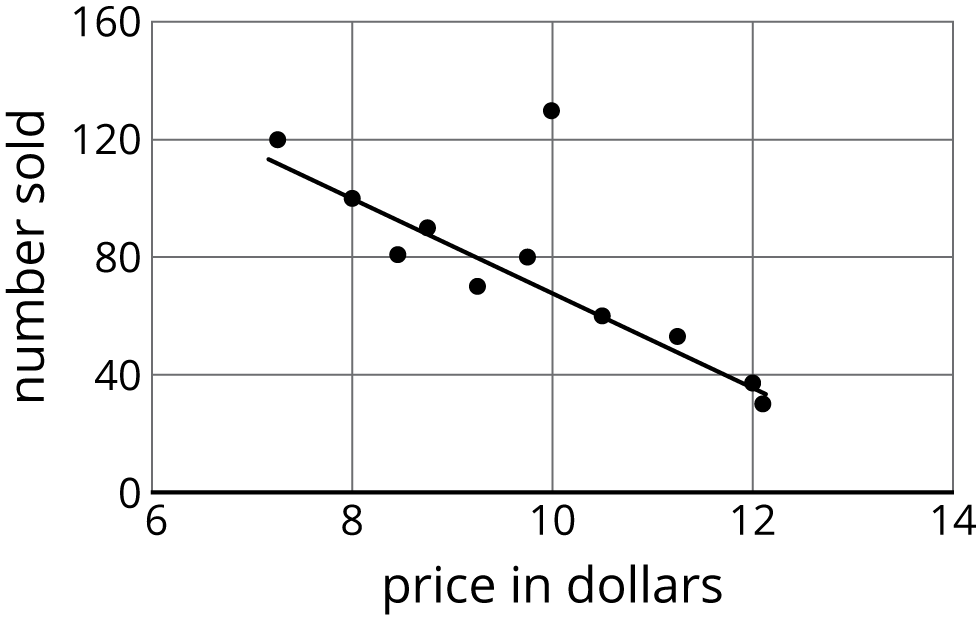
A negative association is a relationship between two quantities where one tends to decrease as the other increases. In a scatter plot, the data points tend to cluster around a line with negative slope.
Different stores across the country sell a book for different prices.
The scatter plot shows that there is a negative association between the the price of the book in dollars and the number of books sold at that price.
- outlier
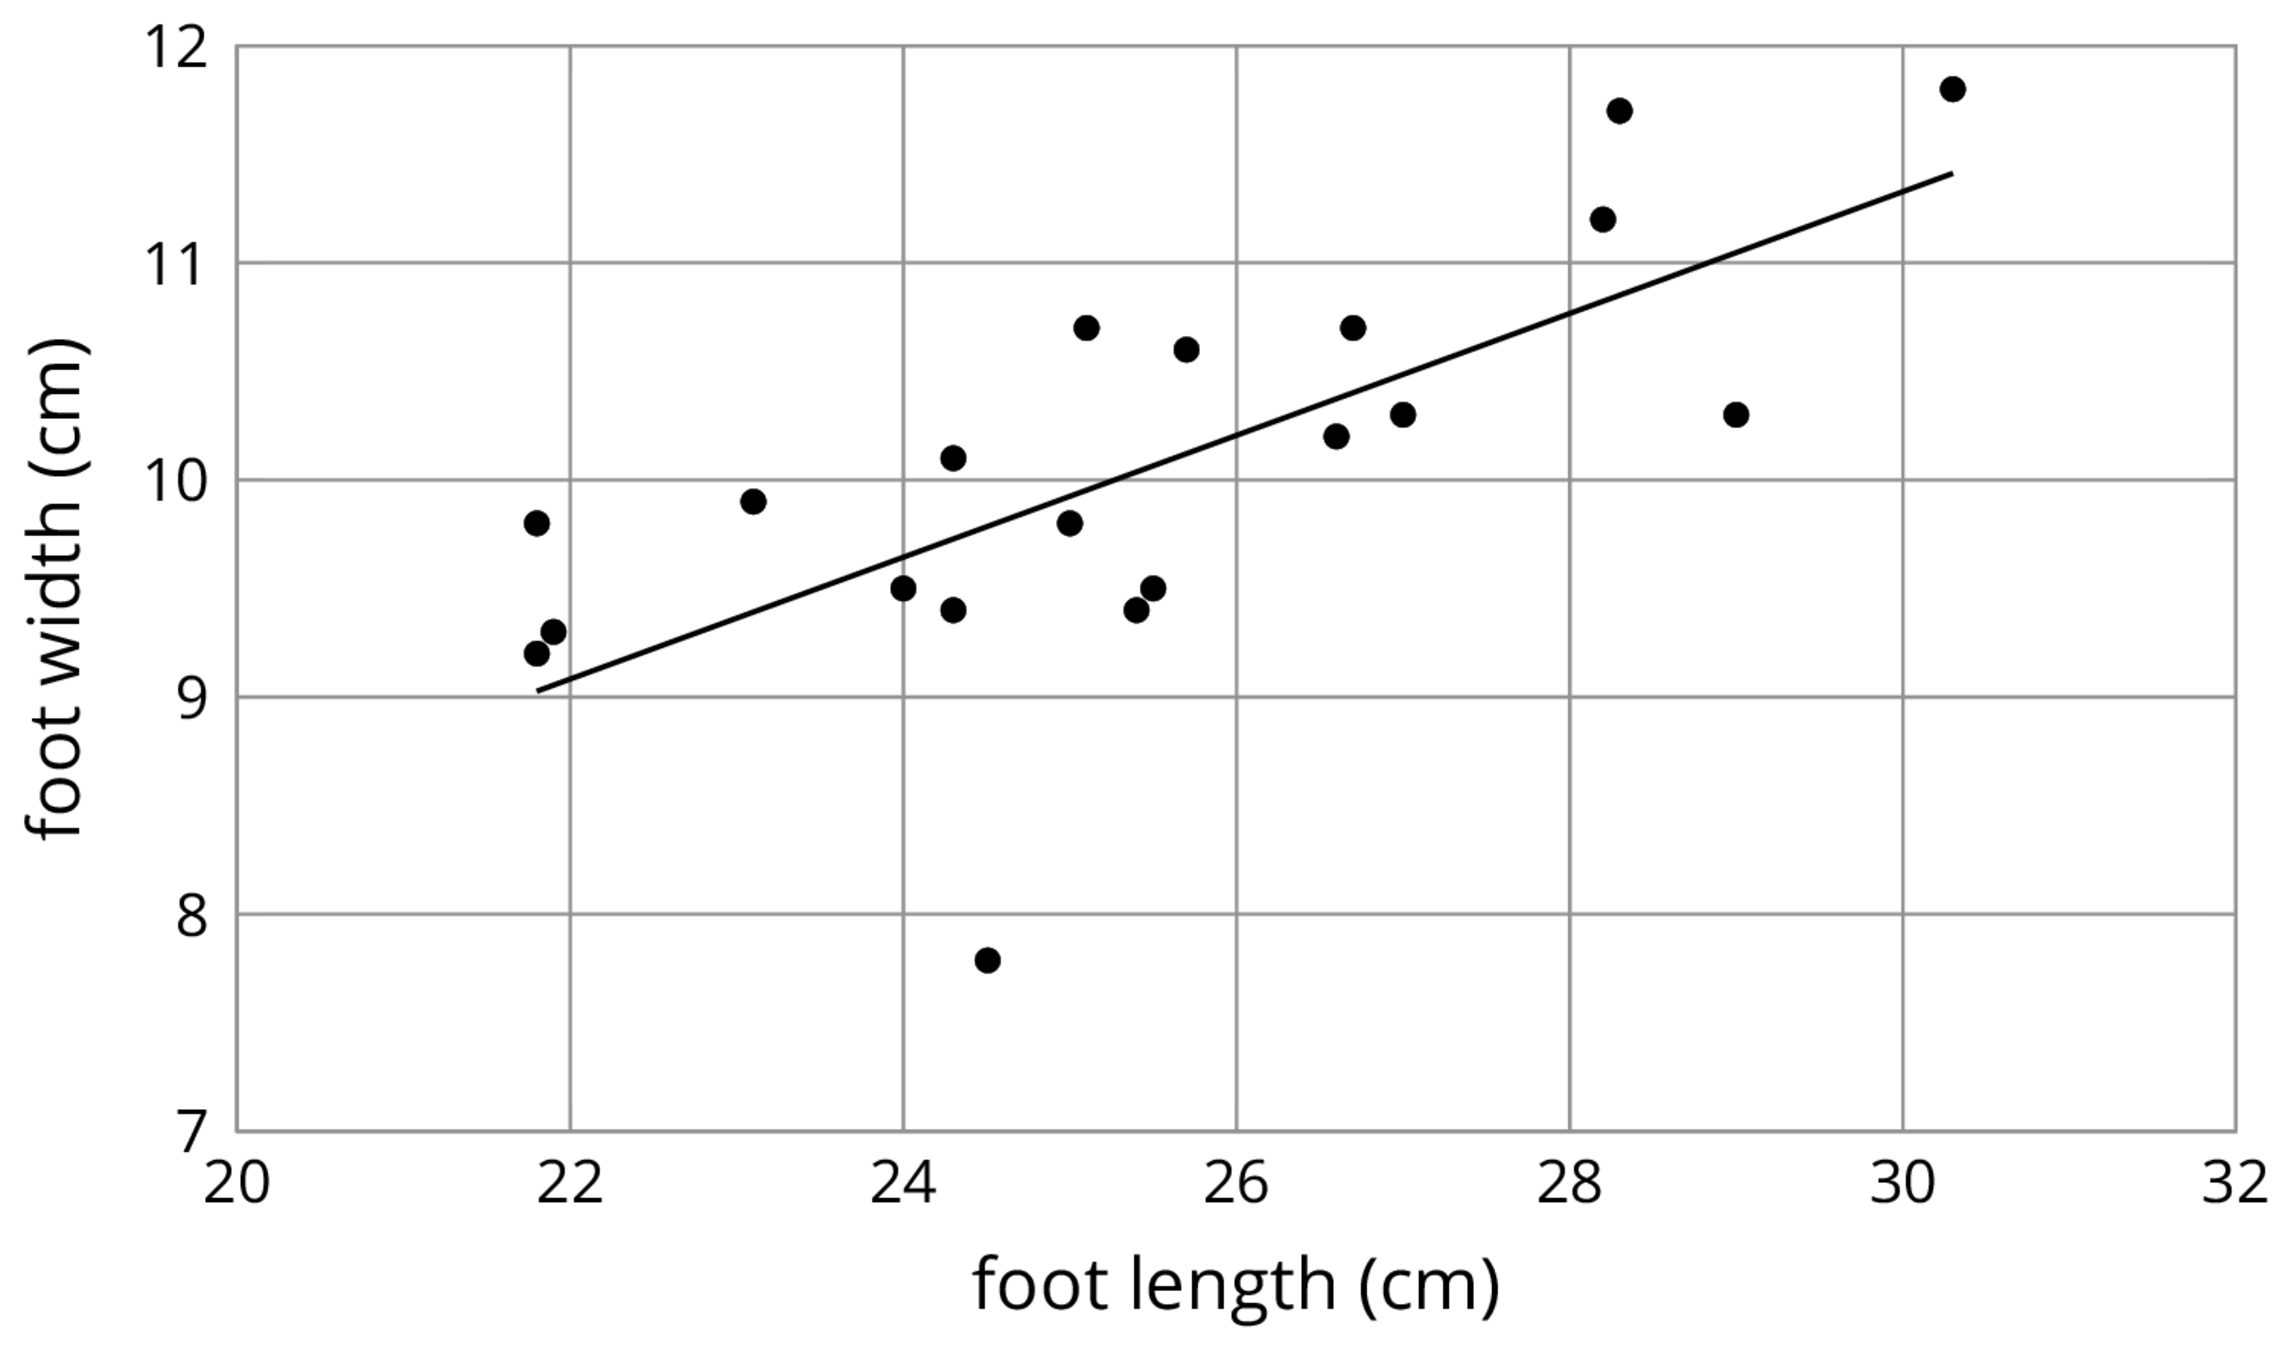
An outlier is a data value that is far from the other values in the data set.
Here is a scatter plot that shows lengths and widths of 20 different left feet. The foot whose length is 24.5 cm and width is 7.8 cm is an outlier.
- positive association
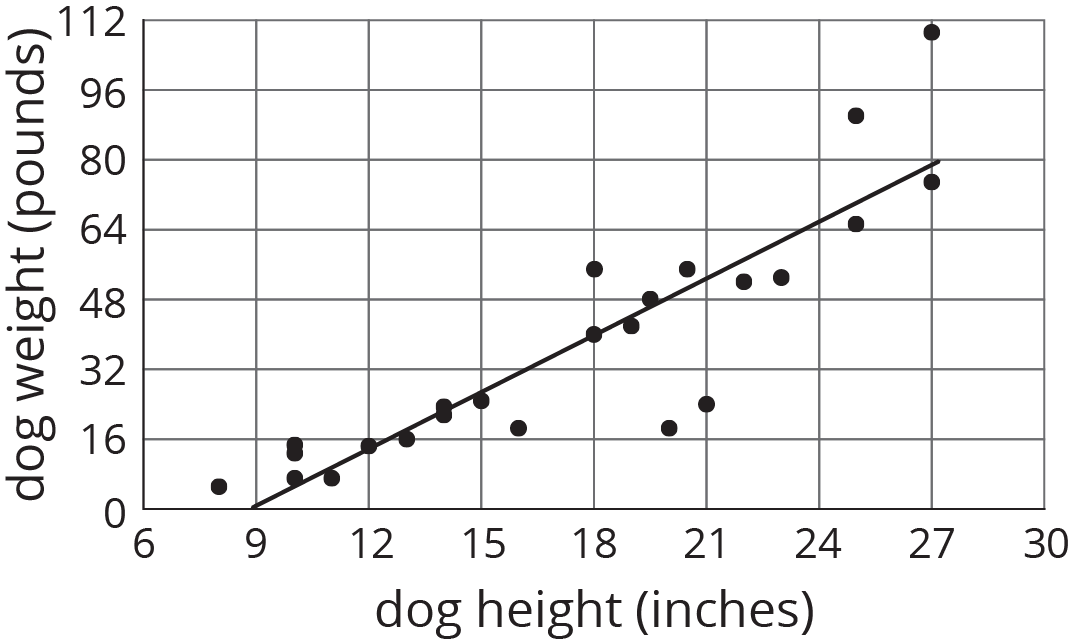
A positive association is a relationship between two quantities where one tends to increase as the other increases. In a scatter plot, the data points tend to cluster around a line with positive slope.
The relationship between height and weight for 25 dogs is shown in the scatter plot. There is a positive association between dog height and dog weight.