Lesson 5
Describing Trends in Scatter Plots
Let’s look for associations between variables.
Problem 1
- Draw a line that you think is a good fit for this data. For this data, the inputs are the horizontal values, and the outputs are the vertical values.
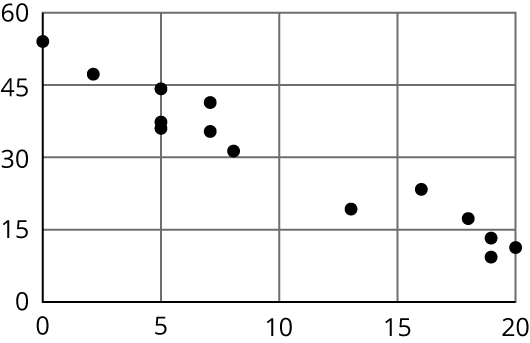
- Use your line of fit to estimate what you would expect the output value to be when the input is 10.
Problem 2
Here is a scatter plot that shows the most popular videos in a 10-year span.
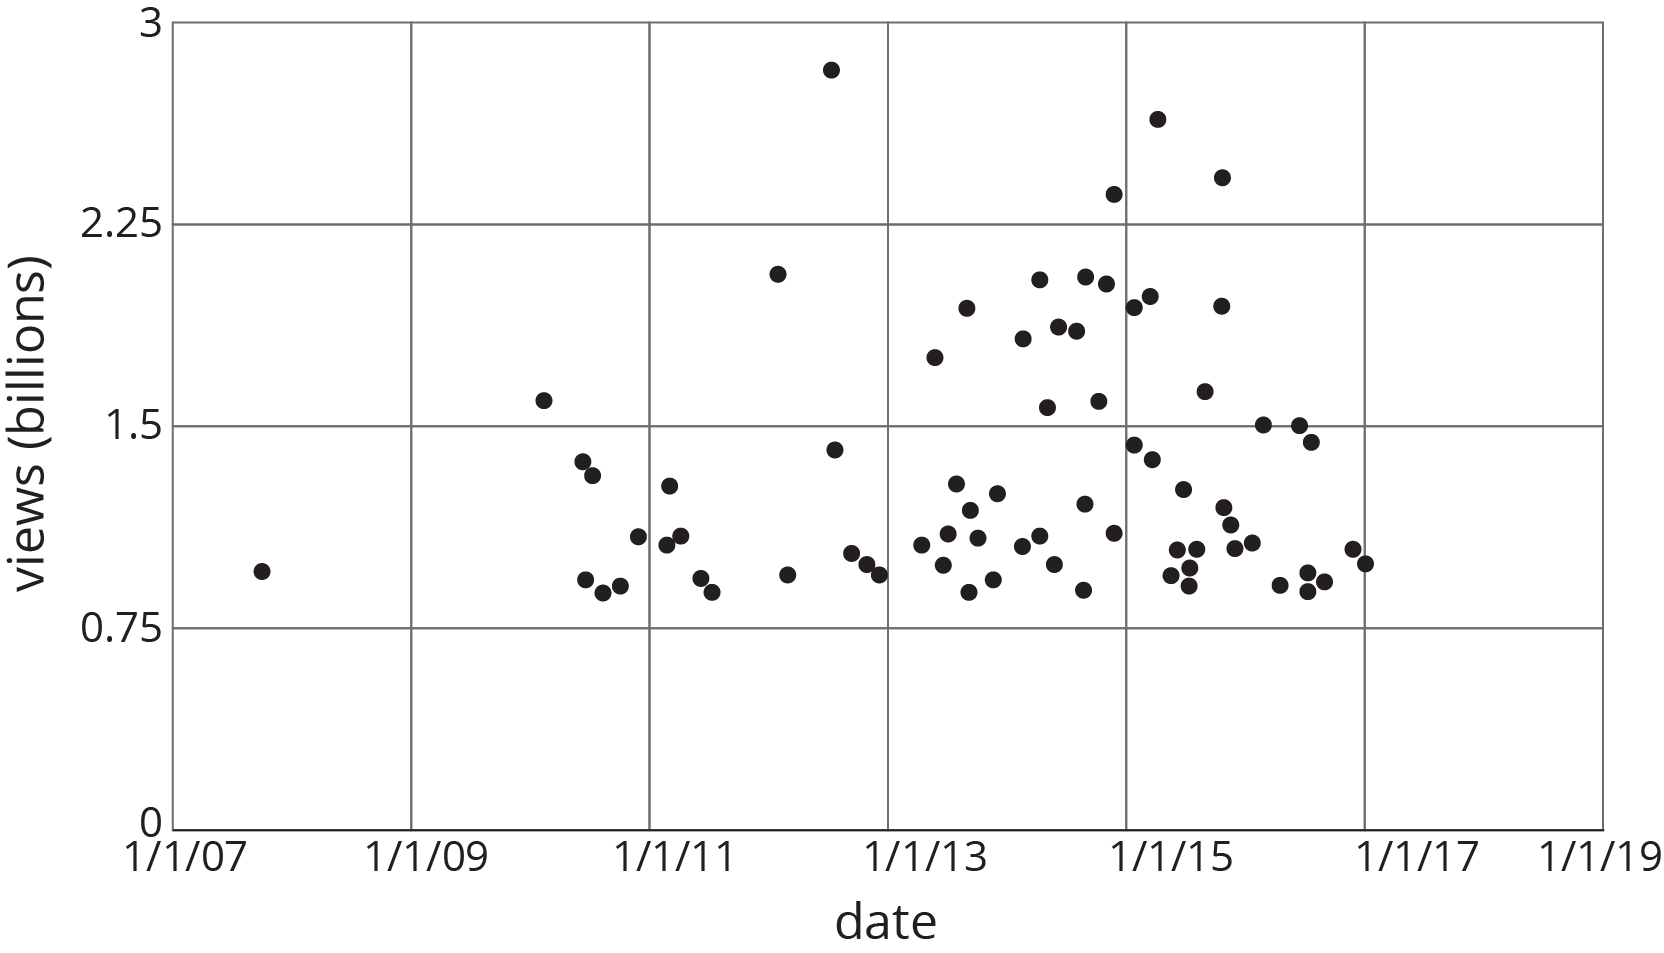
- Use the scatter plot to estimate the number of views for the most popular video in this 10-year span.
- Estimate when the 4th most popular video was released.
Problem 3
A recipe for bread calls for 1 teaspoon of yeast for every 2 cups of flour.
-
Name two quantities in this situation that are in a functional relationship.
-
Write an equation that represents the function.
-
Draw the graph of the function. Label at least two points with input-output pairs.