Lesson 3
What a Point in a Scatter Plot Means
Let’s investigate points in scatter plots.
Problem 1
Here is a table and a scatter plot that compares points per game to free throw attempts for a basketball team during a tournament.
| player |
free throw |
points |
|---|---|---|
| player A | 5.5 | 28.3 |
| player B | 2.1 | 18.6 |
| player C | 4.1 | 13.7 |
| player D | 1.6 | 10.6 |
| player E | 3.1 | 10.4 |
| player F | 1 | 5 |
| player G | 1.2 | 5 |
| player H | 0.7 | 4.7 |
| player I | 1.5 | 3.7 |
| player J | 1.5 | 3.5 |
| player K | 1.2 | 3.1 |
| player L | 0 | 1 |
| player M | 0 | 0.8 |
| player N | 0 | 0.6 |
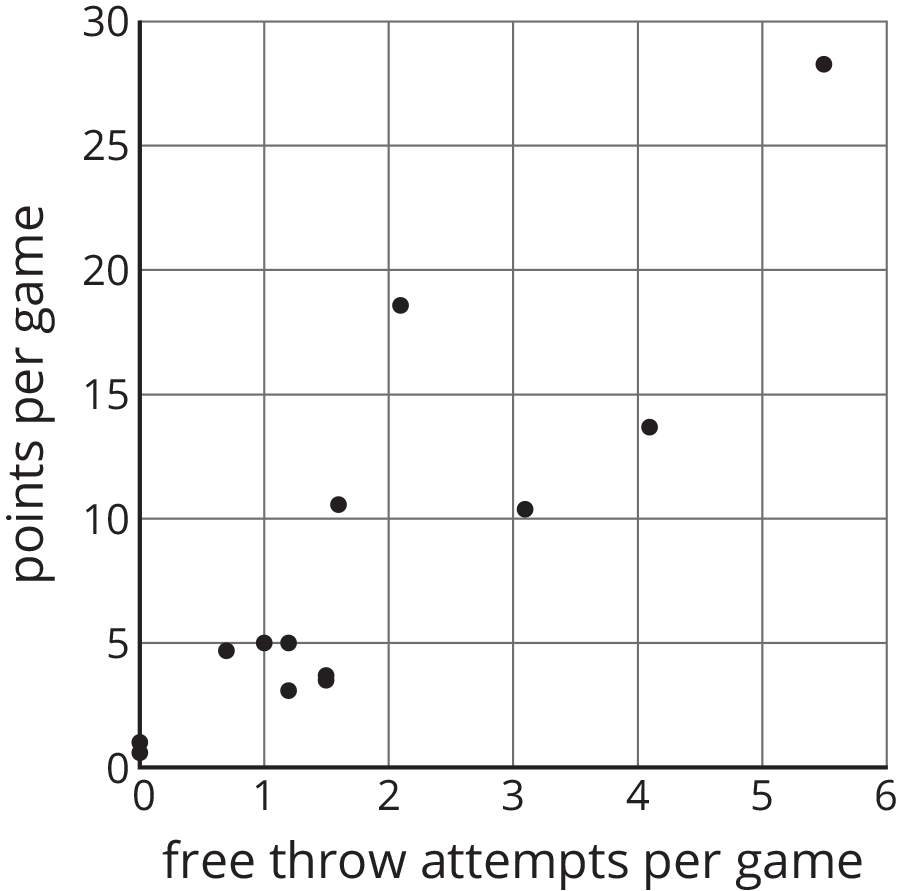
- Circle the point that represents the data for Player E.
- What does the point \((2.1,18.6)\) represent?
- In that same tournament, Player O on another team scored 14.3 points per game with 4.8 free throw attempts per game. Plot a point on the graph that shows this information.
Problem 2
Select all the representations that are appropriate for comparing exam score to number of hours of sleep the night before the exam.
A:
Histogram
B:
Scatter plot
C:
Dot plot
D:
Table
E:
(From Unit 6, Lesson 2.)
Box plot
Problem 3
A cylinder has a volume of \(36\pi\) cm3 and height \(h\). Complete this table for the volume of other cylinders with the same radius but different heights.
| height (cm) | volume (cm3) |
|---|---|
| \(h\) | \(36\pi\) |
| \(2h\) | |
| \(5h\) | |
| \(\frac h2\) | |
| \(\frac h5\) |