Lesson 8
Exponential Situations as Functions
8.1: Rainfall in Las Vegas (5 minutes)
Warm-up
The goal of this warm-up is to review the meaning of a function presented graphically. While students do not need to use function notation here, interpreting the graph in terms of the context will prepare them for their work with functions in the rest of the unit.
Launch
Tell students to close their books or devices. Display the graph for all to see. Ask students to observe the graph and be prepared to share one thing they notice and one thing they wonder. Select students to briefly share one thing they noticed or wondered to help ensure all students understand the information conveyed in the graph. Ask students to open their books or devices and answer the questions about the graph. Follow with a whole-class discussion.
Student Facing
Here is a graph of the accumulated rainfall in Las Vegas, Nevada, in the first 60 days of 2017.
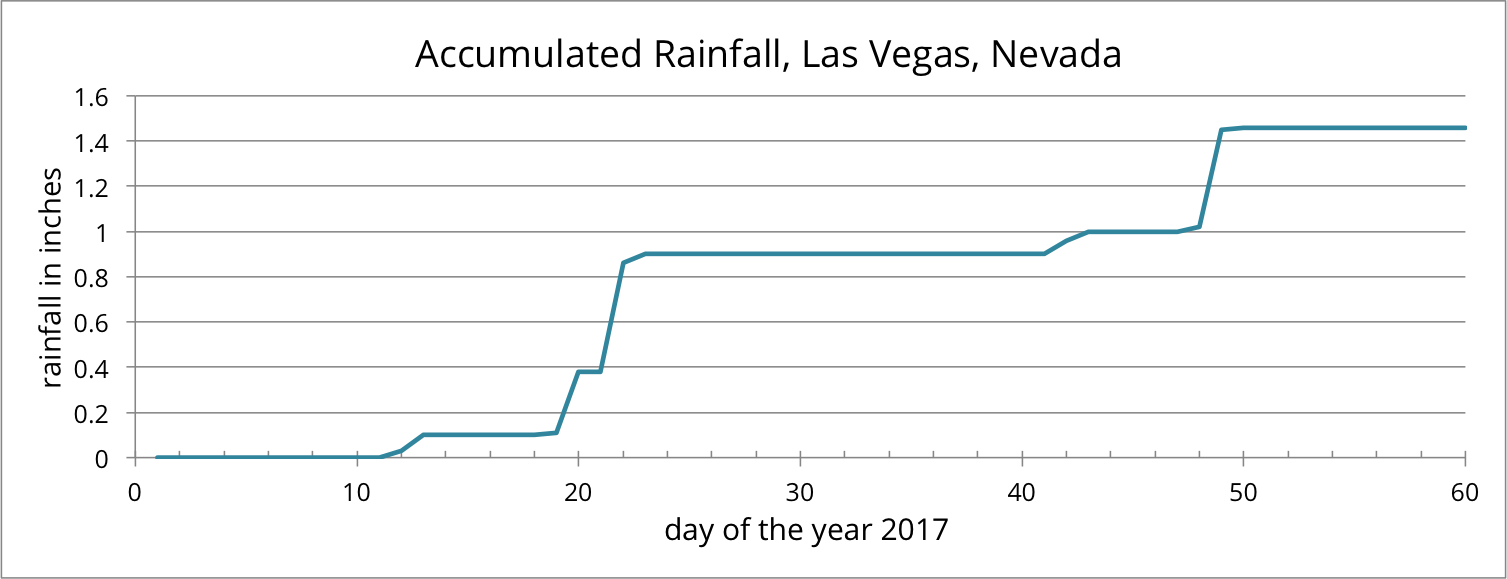
Use the graph to support your answers to the following questions.
- Is the accumulated amount of rainfall a function of time?
- Is time a function of accumulated rainfall?
Student Response
For access, consult one of our IM Certified Partners.
Anticipated Misconceptions
If students struggle to see from the graph how the accumulated rainfall is a function of time but time is not a function of accumulated rainfall, consider displaying the data in a table. Shown here is the data for the first 20 days of 2017. Help students see that for every value of \(t\), the time in days, there is one value of \(r\), the accumulated rainfall in inches, but this is not true the other way around.
| \(t\) (days) | 1 | 2 | 3 | 4 | 5 | 6 | 7 | 8 | 9 | 10 | 11 | 12 | 13 | 14 | 15 | 16 | 17 | 18 | 19 | 20 |
|---|---|---|---|---|---|---|---|---|---|---|---|---|---|---|---|---|---|---|---|---|
| \(r\) (inches) | 0 | 0 | 0 | 0 | 0 | 0 | 0 | 0 | 0 | 0 | 0 | 0.03 | 0.1 | 0.1 | 0.1 | 0.1 | 0.1 | 0.1 | 0.11 | 0.38 |
Activity Synthesis
Make sure students understand why the accumulated rain is a function of time but not the other way around.
Then, recall the notation for writing, using function notation, accumulated rain fall as a function of time. If \(r\) represents the amount of rainfall in inches and \(t\) is time in days, then \(r(t)\) is the amount of rain that has fallen in the first \(t\) days of 2017. For example, \(r(2) = 0\) tells us that the accumulated rainfall after in the first two days of the year was 0 inches. \(r(48)=1\) means that there was 1 inch of accumulated rain in the first 48 days of the year. Ask students to write and explain the meaning of a few other statements using function notation.
8.2: Moldy Bread (15 minutes)
Activity
In this activity, students represent a situation using a table of values, a graph, and an equation. From the exponential equation, it is a short step to thinking of the relationship between the quantities as a function.
Note that it is possible and acceptable to think of time as a function of area, but expressing this using an equation is out of the scope of this course. Students could, however, represent such a function with a graph, table, or description.
Making graphing technology available gives students an opportunity to choose appropriate tools strategically (MP5).
Launch
Supports accessibility for: Conceptual processing; Visual-spatial processing
Student Facing
Clare noticed mold on the last slice of bread in a plastic bag. The area covered by the mold was about 1 square millimeter. She left the bread alone to see how the mold would grow. The next day, the area covered by the mold had doubled, and it doubled again the day after that.
- If the doubling pattern continues, how many square millimeters will the mold cover 4 days after she noticed the mold? Show your reasoning.
- Represent the relationship between the area \(A\), in square millimeters, covered by the mold and the number of days \(d\) since the mold was spotted using:
- A table of values, showing the values from the day the mold was spotted through 5 days later.
- An equation
- A graph
- Discuss with your partner: Is the relationship between the area covered by mold and the number of days a function? If so, write ____ is a function of ____. If not, explain why it is not.
Student Response
For access, consult one of our IM Certified Partners.
Student Facing
Are you ready for more?
What do you think an appropriate domain for the mold area function \(A\) is? Explain your reasoning.
Student Response
For access, consult one of our IM Certified Partners.
Anticipated Misconceptions
Students may have trouble understanding how to account for time in the first question. They may benefit from writing the area after 1 day has passed, 2 days have passed, etc. A table is a convenient way to gather this information.
Activity Synthesis
Discuss why the area covered by mold is a function of the number of days that have passed. Attend explicitly to language students learned in the prior unit on functions: The area of the mold \(A\) is a function of the number of days \(d\) since the mold was spotted, \(A = f(d)\). The function \(f\) expressing the mold relationship can be written as \(f(d) = 1 \boldcdot 2^d\), where \(d\) measures days since the mold was spotted and \(f(d)\) gives the area covered by the mold in square millimeters.
Discuss whether a discrete graph or a curve is more appropriate and what domain would be suitable in this context. Ask questions such as:
- “Can the independent variable be something like 1.5, a number that is not a whole number? Is there an area that is associated with 1.5 days?” (Yes, some area of the bread is covered by mold at any point in time. The mold doesn't disappear after being spotted and then reappear at exactly 1 full day, 2 full days, etc.)
- “What would be the meaning of a point on the graph where the value of \(d\) is, for instance, between 2 and 3?” (It would mean the area covered by mold at some point longer than 2 days but less than 3 days after mold was spotted.)
- “What domain would be appropriate for this function? Can the mold grow indefinitely?” (Since the area of the bread (the range) is limited, the exponential growth cannot continue indefinitely. By the end of one week, more than 1 square cm will be covered and, by the end of the second week, the values of the function will be close to or will exceed the total area of the bread.)
Students using paper and pencil may decide that it makes sense to connect the points on the graph but they will not yet know how to do so. Consider stating that they are connected (in a very specific way) and their properties will be studied later.
Students using the digital version (or graphing technology along with the paper and pencil version) will see the continuous graph. If desired, you may want to demonstrate how using function notation to write the equation like \(f(d) = 1 \boldcdot 2^d\) can be put to use. Try typing \(A(2)\) or \(A(\text-1)\).
Design Principle(s): Maximize meta-awareness
8.3: Functionally Speaking (15 minutes)
Activity
Students have described and analyzed situations involving exponential change, using graphs, tables, and equations. Now they revisit several of these contexts, viewing them as functions and expressing them using function language and notation.
Each situation involves two quantities and students will need to choose one of these to be the independent variable and one to be the dependent variable. For all of these relationships, it is possible to choose either variable as the independent but one choice gives a logarithmic function (which is out of the scope of this course), while the other gives an exponential function. In each case, however, students have previously worked with the context.
Look for students who explicitly state the meaning of their variables, including units, and invite them to share during the discussion. For example, in the second situation, if \(t\) represents the number of years and \(v\) represents the value of the car, in dollars, after \(t\) years then \(v\) can be viewed as a function \(f\) of \(t\) where \(f(t) = 18,\!000 \boldcdot \left(\frac{2}{3}\right)^t\). The meaning and units for both \(t\) and \(f(t)\) (or \(v\)) are vital elements to answering the question fully.
Launch
Tell students that they will now revisit some previously seen situations. Ask students to read the three situations in the task, then solicit a few ideas on why all of them can be seen as functions.
Supports accessibility for: Conceptual processing; Memory
Student Facing
Here are some situations we have seen previously. For each situation:
- Write a sentence of the form "\(\underline{\hspace{0.5in}}\) is a function of \(\underline{\hspace{0.5in}}\)."
- Indicate which is the independent and which is the dependent variable.
- Write an equation that represents the situation using function notation.
- In a biology lab, a population of 50 bacteria reproduce by splitting. Every hour, on the hour, each bacterium splits into two bacteria.
- Every year after a new car is purchased, it loses \(\frac13\) of its value. Let’s say that the new car costs $18,000.
- In order to control an algae bloom in a lake, scientists introduce some treatment products. The day they begin treatment, the area covered by algae is 240 square yards. Each day since the treatment began, a third of the previous day’s area (in square yards) remains covered by algae. Time \(t\) is measured in days.
Student Response
For access, consult one of our IM Certified Partners.
Anticipated Misconceptions
Students may confuse the terms "independent" and "dependent." Help them to think about which variable depends on the other in context.
Activity Synthesis
Invite selected students to present their equations, making sure to indicate what each variable represents, as well as the units of the variable.
For the third question, point out that it is a short step from an equation for the area covered by the algae \(A =240 \boldcdot \left(\frac{1}{3}\right)^t\) to a similar equation with function notation. The equation gives the area covered by the algae at each time \(t\), so a function \(f\) can be defined using the same expression: \(f(t) =240 \boldcdot \left(\frac{1}{3}\right)^t\) and \(A = f(t)\).
Design Principle(s): Support sense-making
8.4: Deciding on Graphing Window (20 minutes)
Optional activity
This optional activity further addresses the skill of choosing an appropriate graphing window when using graphing technology. In an earlier activity, students looked at how adjusting the graphing window affects the usefulness of the graph. Here they gauge the reasonableness of a graphing window given an equation and a description of a function.
Because exponential functions eventually grow very quickly, the graph tends to quickly go off the screen if the domain is too large. The graphing window can be adjusted to display large values for the vertical axis, but in doing so, the output values for most of the domain will all look like they are essentially 0.
To decide on the reasonableness of the given graphing boundaries, students may evaluate the function at the endpoints of the domain for the graphing window. Look for students who think carefully about the domain, observing that, based on the context, the equation probably does not model even modest negative values of the input variable. This activity represents scaffolded practice for an important aspect of mathematical modeling (MP4).
Launch
Provide access to graphing technology.
Student Facing
The equation \(m = 20\boldcdot (0.8)^h\) models the amount of medicine \(m\) (in milligrams) in a patient’s body as a function of hours, \(h\), after injection.
- Without using a graphing tool, decide if the following horizontal and vertical boundaries are suitable for graphing this function. Explain your reasoning.
\(\displaystyle \text-10< h<100\)
\(\displaystyle \text-100< m<1,000\) - Verify your answer by graphing the equation using graphing technology, and using the given graphing window. What do you see? Sketch or describe the graph.
- If your graph in the previous question is unhelpful, modify the window settings so that the graph is more useful. Record the window settings here. Convince a partner why the horizontal and vertical boundaries that you set are better.
Student Response
For access, consult one of our IM Certified Partners.
Activity Synthesis
Select students to share their graphs, the one created using the given horizontal and vertical boundaries, as well as the improved versions. Or display the graphs in the sample responses for all to see. Discuss questions such as:
- “Why were the given boundaries not good?” (The domain and range are both too wide. The range is so large that almost all the points look like they're about 0. It is even hard to tell what the starting value is.)
- “How can the context help us choose an appropriate graphing window?” (Negative values of time probably are not relevant because the amount of medicine in the body before the injection is likely insignificant or is not modeled by the equation. Large values of time (say \(t=100\)) are not likely important because the effects of the medicine after 100 hours are likely to be minimal.)
Graphing exponential functions can be challenging because they can increase or decrease very quickly. Emphasize that an appropriate graphing window can often be selected using the context. Once the relevant domain of a function and the horizontal boundaries of a graph are chosen, the vertical boundaries can be selected based on the output values for that domain so that any meaningful trends (for example, exponential decay) are visible.
Lesson Synthesis
Lesson Synthesis
Many of the situations we have seen that are characterized by exponential growth can also be viewed as functions. Review why we can think of them as functions and how they compare to other functions they have studied.
Consider a bacteria population \(p\), described by the equation \(p = 1,\!000 \boldcdot 2^t\), where \(t\) is the number of hours after it is first measured.
- “Complete the sentence for this situation: _____ is a function of _____.” (The number of bacteria is a function of time, or \(p\) is a function of \(t\).)
- “How is \(p\) related to the function \(f\) given by \(f(t) = 1,\!000 \boldcdot 2^t\)?” (\(p = f(t)\))
- “How are these equations like or different from the equations you've written previously, without function notation?” (They express the relationships the same way. Both equations can be used to produce a table or graph or to answer questions about the bacteria population. The notation \(p = f(t)\) makes explicit that \(p\) depends on \(t\).)
- “How are the exponential functions here like or different from linear functions we saw earlier in the course?” (Both functions represent relationships where one quantity is determined by another quantity, and there is only one possible output for every input. They are different in that linear functions grow by addition and exponential functions grow by multiplication.)
8.5: Cool-down - Beaver Population (5 minutes)
Cool-Down
For access, consult one of our IM Certified Partners.
Student Lesson Summary
Student Facing
The situations we have looked at that are characterized by exponential change can be seen as functions. In each situation, there is a quantity—an independent variable—that determines another quantity—a dependent variable. They are functions because any value of the independent variable corresponds to one and only one value of the dependent variable. Functions that describe exponential change are called exponential functions.
For example, suppose \(t\) represents time in hours and \(p\) is a bacteria population \(t\) hours after the bacteria population was measured. For each time \(t\), there is only one value for the corresponding number of bacteria, so we can say that \(p\) is a function of \(t\) and we can write this as \(p = f(t)\).
If there were 100,000 bacteria at the time it was initially measured and the population decreases so that \(\frac{1}{5}\) of it remains after each passing hour, we can use function notation to model the bacteria population:
\(\displaystyle f(t) = 100,\!000 \boldcdot \left(\frac{1}{5}\right)^t\)
Notice the expression in the form of \(a \boldcdot b^t\) (on the right side of the equation) is the same as in previous equations we wrote to represent situations characterized by exponential change.