Lesson 9
Interpreting Exponential Functions
9.1: Equivalent or Not? (5 minutes)
Warm-up
This warm-up addresses a common confusion among students mistaking the expression \(2^x\) for the expression \(x^2\). One good way to address this confusion is by evaluating the expressions for different values of \(x\), which is the path students are likely to take here. Another way to illustrate the distinction is by graphing, though students are less likely to take this approach.
Launch
Display the task for all to see and ask students to read it quietly to themselves. Ask what they think Lin means by equivalent. They may remember from earlier grades, or they may guess based on contrasting her statement with Diego’s statement. Before they start working, be sure that students understand equivalent to mean equal no matter what value is used in place of \(x\).
Student Facing
Lin and Diego are discussing two expressions: \(x^2\) and \(2^x\).
- Lin says, “I think the two expressions are equivalent.”
- Diego says, “I think the two expressions are only equal for some values of \(x\).”
Do you agree with either of them? Explain or show your reasoning.
Student Response
For access, consult one of our IM Certified Partners.
Activity Synthesis
Consider using a blank table or a completed one, as shown here, to facilitate discussion.
| \(x\) | \(x^2\) | \(2^x\) |
|---|---|---|
| 1 | ||
| 2 | ||
| 3 | ||
| 4 | ||
| 5 | ||
| 10 |
| \(x\) | \(x^2\) | \(2^x\) |
|---|---|---|
| 1 | 1 | 2 |
| 2 | 4 | 4 |
| 3 | 9 | 8 |
| 4 | 16 | 16 |
| 5 | 25 | 32 |
| 10 | 100 | 1024 |
Possible questions for discussion:
- “For what values of \(x\) are the two expressions equal?” (when \(x\) is 2 and when \(x\) is 4)
- “Besides substituting different values of \(x\), are there other ways to tell if the two expressions are equal for all values of \(x\) or only some values of \(x\)?” (One way might be to think about possible values the expressions could take when \(x\) is an odd number. \(2^x\) means 2 multiplied by itself \(x\) times. When \(x\) is an odd number, the value of \(2^x\) will be even because of the multiplication by 2. But multiplying an odd-number \(x\) by itself as in \(x^2\)will result in an odd number, so we know that in those instances the expressions are not equal. Another way might be to graph the equations \(y=x^2\) and \(y=2^x\) on the same coordinate plane and examine the graphs.)
- “Which expression grows more quickly?” (For positive values of \(x\), \(2^x\) grows much more quickly than \(x^2\).)
9.2: Cost of Solar Cells (15 minutes)
Activity
Previously, students were presented with descriptions of functions and, in one case, an equation that represents a function. In this activity, students are given the graph of a function and asked to analyze the underlying relationship and describe it using function notation.
The data used in this task is approximate, but the costs of solar energy during the time period mentioned in this activity can be appropriately modeled by an exponential decay model.
Launch
Elicit what students already know about solar cells. If students are unfamiliar with solar power and units of measurement for energy, give a brief introduction. Solar cells turn energy from the Sun into electricity, a form of energy that is useful to humans. Energy is measured using units called watts. Over the course of the past several decades, the cost of solar cells has decreased. That is, we can manufacture solar cells that generate the same amount of electricity for less money.
Read the opening sentence of the task and display the graph for all to see. To help them process the information in the graph and think about functions, ask if the price per watt is a function of time and if the time is a function of the price per watt.
Supports accessibility for: Visual-spatial processing
Student Facing
The cost, in dollars, to produce 1 watt of solar energy is a function of the number of years since 1977, \(t\).
From 1977 to 1987, the cost could be modeled by an exponential function \(f\). Here is the graph of the function.


- What is the statement \(f(9) \approx 6\) saying about this situation?
- What is \(f(4)\)? What about \(f(3.5)\)? What do these values represent in this context?
- When \(f(t)=45\), what is \(t\)? What does that value of \(t\) represent in this context?
- By what factor did the cost of solar cells change each year? (If you get stuck, consider creating a table.)
Student Response
For access, consult one of our IM Certified Partners.
Anticipated Misconceptions
If students struggle with the function notation in the questions, ask them to recall what each part of what “f(t)” means, or remind them that the \(f\) is the name of the function, and the \(t\) is the input value.
Activity Synthesis
Focus the discussion on how students selected points on the graph to calculate the growth factor. Strategically, it is important to choose values of time \(t\) so that the price per watt \(f(t)\), in dollars, is unambiguous (for example \(t\) = 0, \(t = 1\), and \(t = 2\)). Because we are told that the price decreases exponentially, two values are enough to find the growth factor.
Interpreting statements such as \(f(4) = 25\) in terms of the context is a chance to highlight precision in language (MP6), for example, to articulate that the 4 means 4 years after 1977 (1981), and the value \(f(4) = 45\) means that each watt produced via solar energy cost $45 in 1981.
9.3: Paper Folding (15 minutes)
Activity
This activity prompts students to graph equations to solve problems and think about appropriate values of their variables. The context is the thickness and the area of a sheet of paper that is repeatedly folded.
For both equations, only whole numbers make sense as inputs. Students consider why this makes sense in this context. (This is in contrast, for example, to the price of producing solar energy in the earlier activity. While the data given is on an annual basis, it made sense to “connect the dots” because there is a price for producing solar energy at any given time.) Without instruction about how to create a discrete graph with their graphing technology, students are likely to produce a continuous graph. This is a good opportunity to discuss how to interpret a model for a particular context (MP4).
Look for the different ways students use to find out how many folds are needed to reach a certain thickness. Identify students who used a table, a graph, or an equation so they can share later.
Launch
Give each student a sheet of paper. Ask them to fold it in half, and in half again, as many times as they can. (To save paper, you might have students do this in pairs.) Once they have folded it as many times as they can, ask a few students to share how many times they folded it, and estimate the thickness of the folded paper. Tell students that they are going to investigate the relationship between the number of folds and the thickness of the paper.
Provide access to graphing technology. This activity requires students to be mindful about the scale or graphing window. The activities that specifically target that skill are optional, so this gives students a chance to practice scaling the axes.
Design Principle(s): Optimize output (for explanation); Maximize meta-awareness
Student Facing
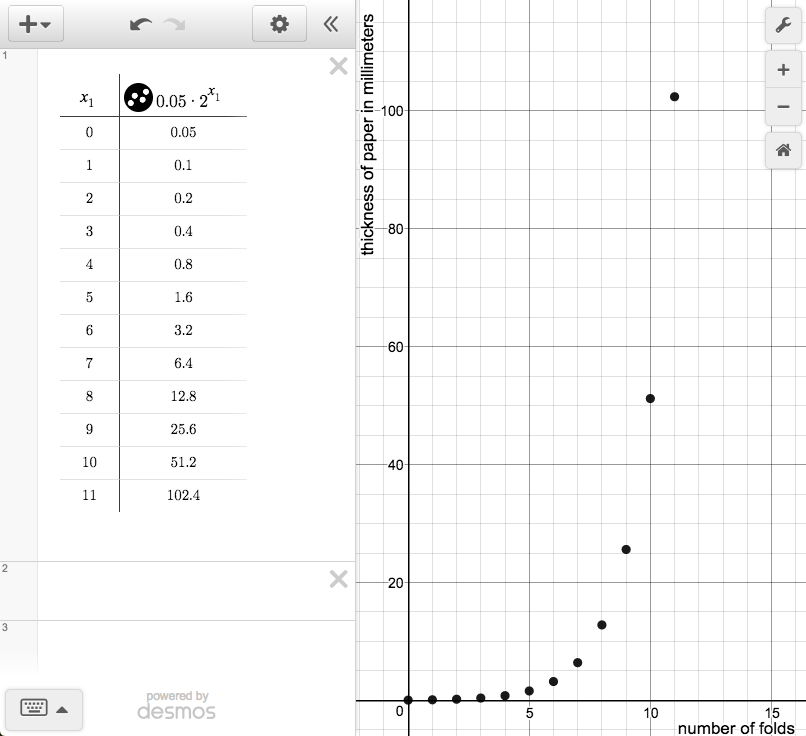
- The thickness \(t\) in millimeters of a folded sheet of paper after it is folded \(n\) times is given by the equation \(t = (0.05) \boldcdot 2^n\).
- What does the number \(0.05\) represent in the equation?
- Use graphing technology to graph the equation \(t = (0.05) \boldcdot 2^n\).
- How many folds does it take before the folded sheet of paper is more than 1 mm thick? How many folds before it is more than 1 cm thick? Explain how you know.
- The area of a sheet of paper is 93.5 square inches.
- Find the remaining, visible area of the sheet of paper after it is folded in half once, twice, and three times.
- Write an equation expressing the visible area \(a\) of the sheet of paper in terms of the number of times it has been folded \(n\).
- Use graphing technology to graph the equation.
- In this context, can \(n\) take negative values? Explain your reasoning.
- Can \(a\) take negative values? Explain your reasoning.
Student Response
For access, consult one of our IM Certified Partners.
Student Facing
Are you ready for more?
- Using the model in this task, how many folds would be needed to get 1 meter in thickness? 1 kilometer in thickness?
- Do some research: what is the current world record for the number of times humans were able to fold a sheet of paper?
Student Response
For access, consult one of our IM Certified Partners.
Anticipated Misconceptions
If students have trouble organizing their data points, suggest that they use a table.
Activity Synthesis
Focus the discussion on:
- How students identified the growth factor, given an equation or a description.
- How students determined how many folds are needed to reach a certain thickness. Invite previously identified students to share their strategies.
- The meaningful values of the variables in the equations:
- Highlight that a discrete graph is more appropriate in both situations: only the whole-number values make sense for the number of folds because it is not possible to fold the paper a fractional number of times.
- Practically speaking, a large number of folds, such as 36, is not possible.
Demonstrate, using graphing technology, how to graph the equations and invite students to share how they chose an appropriate graphing window. If students just typed an equation, most likely the tool plotted a continuous curve. This is an opportunity to talk about interpreting the continuous graph in this context: really, only whole-number values for \(n\) are meaningful. Time permitting, you might demonstrate how to graph only whole number values of \(n\) using your graphing technology of choice. Typically, this is done by using the technology to generate a table based on a rule. Here is an example:
9.4: Info Gap: Smartphone Sales (15 minutes)
Optional activity
This optional activity gives students an additional opportunity to apply what they know about key characteristics of an exponential function and use it to model real-world data. Unlike previous activities, the data have not been adjusted to perfectly fit an exponential model. Students will need to make estimates and think strategically about what model to choose. Because the years chosen for data points are close together, students may use repeated multiplication to answer the questions rather than writing and evaluating an expression that models the exponential function.
The activity also allows students to practice articulating their reasoning process. The info gap structure requires students to determine what information is necessary to solve a problem and then to ask for the information. This may take several rounds of discussion, as their first requests may not yield the necessary information (MP1). It also allows students to refine the language they use and ask increasingly more precise questions until they get the information they need (MP6).
Here is the text of the cards for reference and planning:
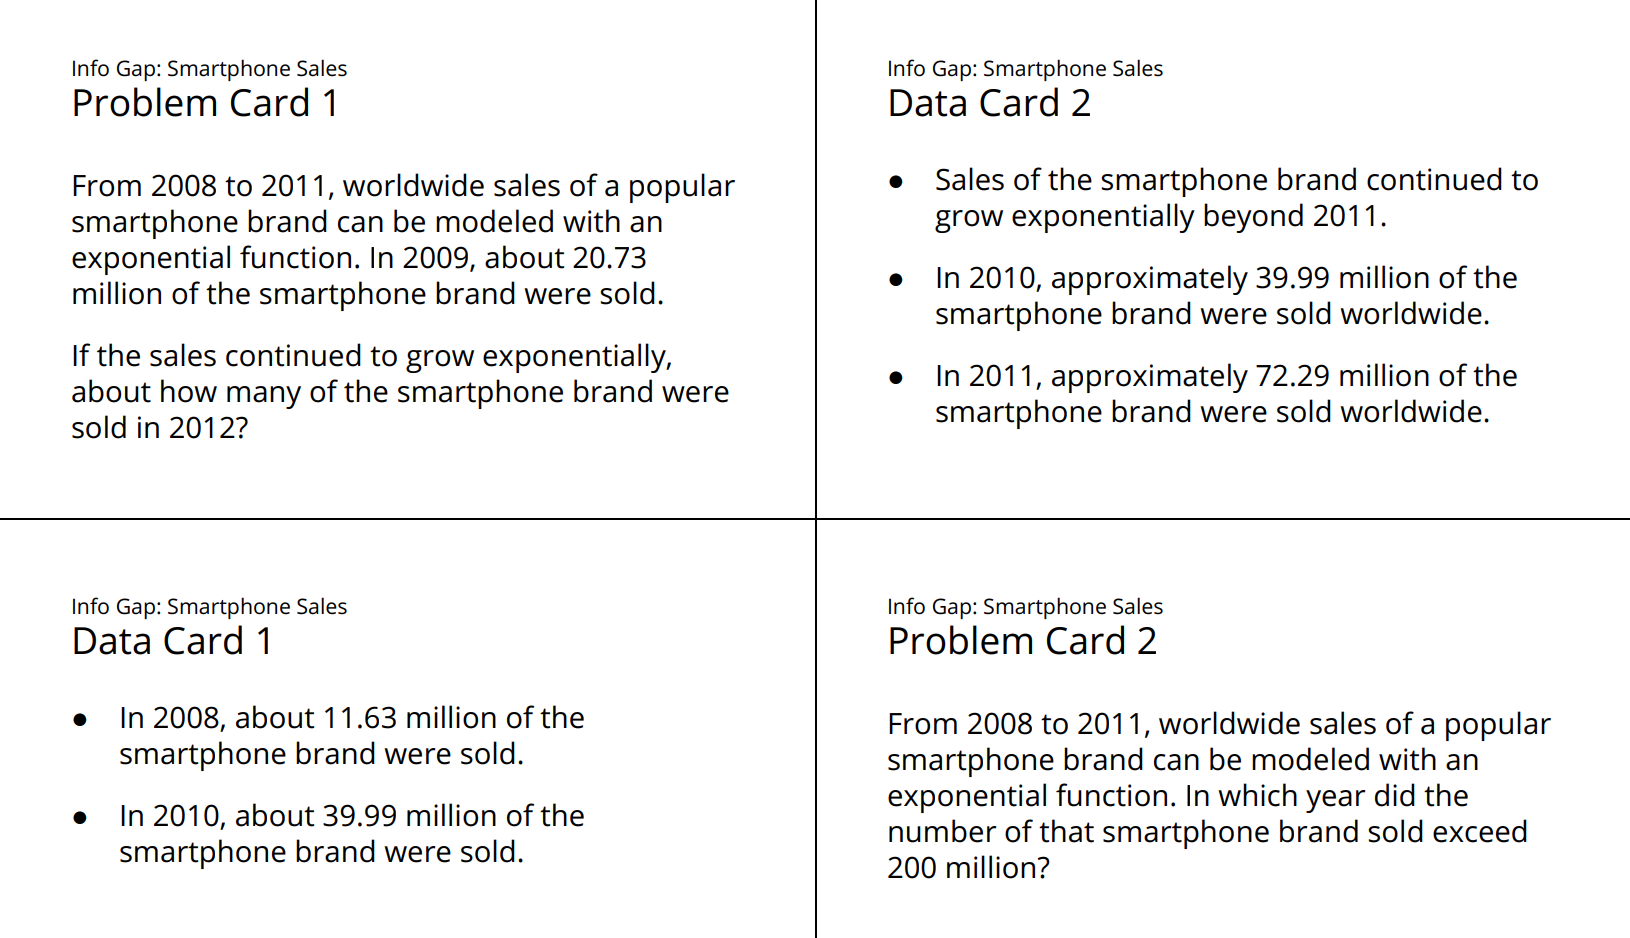
In Problem Card 1, answers will vary based on the data points and the strategy students use to find the growth factor. Strategies to watch for include:
-
Estimate that the phone sales are roughly doubling each year and use that to estimate future sales
-
Calculate a growth factor using the data from two consecutive years
-
Find the average of the growth factors between 2008 and 2009 and between 2009 and 2010
For the second problem, the third approach will not arise because only two sales numbers are available on the data card.
Launch
Tell students they will continue to work with interpreting exponential relationships. Ask students “How many of you have a smartphone?” Give students a brief overview on the first appearance of smartphones and when they became widely popular (around 2007). Explain that annual records of smartphone sales are available starting from 2008 until now.
Explain the info gap structure, and consider demonstrating the protocol if students are unfamiliar with it.
Arrange students in groups of 2. In each group, distribute a problem card to one student and a data card to the other student. After reviewing students' work on the first problem, give them the cards for a second problem and instruct partners to switch roles.
Design Principle(s): Cultivate Conversation
Supports accessibility for: Memory; Organization
Student Facing
Your teacher will give you either a problem card or a data card. Do not show or read your card to your partner.
If your teacher gives you the data card:
- Silently read the information on your card.
- Ask your partner “What specific information do you need?” and wait for your partner to ask for information. Only give information that is on your card. (Do not figure out anything for your partner!)
- Before telling your partner the information, ask “Why do you need to know (that piece of information)?”
- Read the problem card, and solve the problem independently.
- Share the data card, and discuss your reasoning.
If your teacher gives you the problem card:
- Silently read your card and think about what information you need to answer the question.
- Ask your partner for the specific information that you need.
- Explain to your partner how you are using the information to solve the problem.
- When you have enough information, share the problem card with your partner, and solve the problem independently.
- Read the data card, and discuss your reasoning.
Pause here so your teacher can review your work. Ask your teacher for a new set of cards and repeat the activity, trading roles with your partner.
Student Response
For access, consult one of our IM Certified Partners.
Activity Synthesis
Invite students to share different ways they estimated a growth factor for smartphone sales, including:
- using a rough estimate of 2
- using sales data from two consecutive years (2008 and 2009, or 2009 and 2010)
- using sales data from all three years and taking an average of growth factors for consecutive years
The first of these methods is efficient and allows for quick calculations. It is not as accurate, however, as the other estimates and may lead to a less reliable prediction. In this case, it leads to an overestimate of phone sales since the actual growth factors are less than 2.
Consider showing a model and a graph generated using a calculator or graphing technology. Based on this model, about 125 million of that brand of smartphones were sold in 2012.

Next, focus the whole-class discussion on the limitations of a real-world model. In this context, market saturation limits the growth of the cell phone sales. Discuss questions such as:
-
“According to your model, how many smartphones were sold worldwide in 2018?” (About 5 billion.)
-
“The world population in 2018 is about 7.6 billion. Is the number of smartphones sold based on your model realistic? Why or why not?” (No. Allowing for children, the elderly, and underdeveloped countries, 66% of the population buying one brand of smartphone is not realistic.)
-
“Could the sales of smartphones continue to grow exponentially? Why or why not?” (No. There is a finite number of people who will buy a particular brand of smartphone. The data should level off, with surges when new models come out.)
Lesson Synthesis
Lesson Synthesis
In this lesson, we used exponential functions to answer questions about different situations. In a previous lesson, we saw that a function \(f\) defined by \(f(t) = 240 \boldcdot \left(\frac{1}{3}\right)^t\) represents the area of algae in square yards after \(t\) weeks of treatment. Discuss how the equation could be used to:
- produce a graph
- find the area of the algae 6 weeks after treatment
- find out when the algae would drop below 10 square yards
Ask students what \(f(1)=80\) and \(f(2)=\frac{80}{3}\) mean in this context. To reiterate the importance of choosing an appropriate graphing window, ask students to give examples of a graphing window that would be appropriate (or inappropriate) for this function. Time permitting, demonstrate the outcomes of their suggestions using graphing technology.
9.5: Cool-down - Bacteria Population (5 minutes)
Cool-Down
For access, consult one of our IM Certified Partners.
Student Lesson Summary
Student Facing
Earlier, we used equations to represent situations characterized by exponential change. For example, to describe the amount of caffeine \(c\) in a person’s body \(t\) hours after an initial measurement of 100 mg, we used the equation \(c = 100\boldcdot \left(\frac{9}{10}\right)^t\).
Notice that the amount of caffeine is a function of time, so another way to express this relationship is \(c = f(t)\) where \(f\) is the function given by \(f(t)=100 \boldcdot \left( \frac{9}{10} \right)^t\)
We can use this function to analyze the amount of caffeine. For example, when \(t\) is 3, the amount of caffeine in the body is \(100 \boldcdot\left(\frac{9}{10}\right)^3\)or \(100 \boldcdot \frac{729}{1,000}\), which is 72.9. The statement \(f(3) = 72.9\) means that 72.9 mg of caffeine are present 3 hours after the initial measurement.
We can also graph the function \(f\) to better understand what is happening. The point labeled \(P\), for example, has coordinates approximately \((10,35)\) so it takes about 10 hours after the initial measurement for the caffeine level to decrease to 35 mg.

A graph can also help us think about the values in the domain and range of a function. Because the body breaks down caffeine continuously over time, the domain of the function—the time in hours—can include non-whole numbers (for example, we can find the caffeine level when \(t\) is 3.5). In this situation, negative values for the domain would represent the time before the initial measurement. For example \(f(\text-1)\) would represent the amount of caffeine in the person's body 1 hour before the initial measurement. The range of this function would not include negative values, as a negative amount of caffeine does not make sense in this situation.