Lesson 13
Fractional Measurements on Line Plots
Warm-up: Notice and Wonder: Which Ruler? (10 minutes)
Narrative
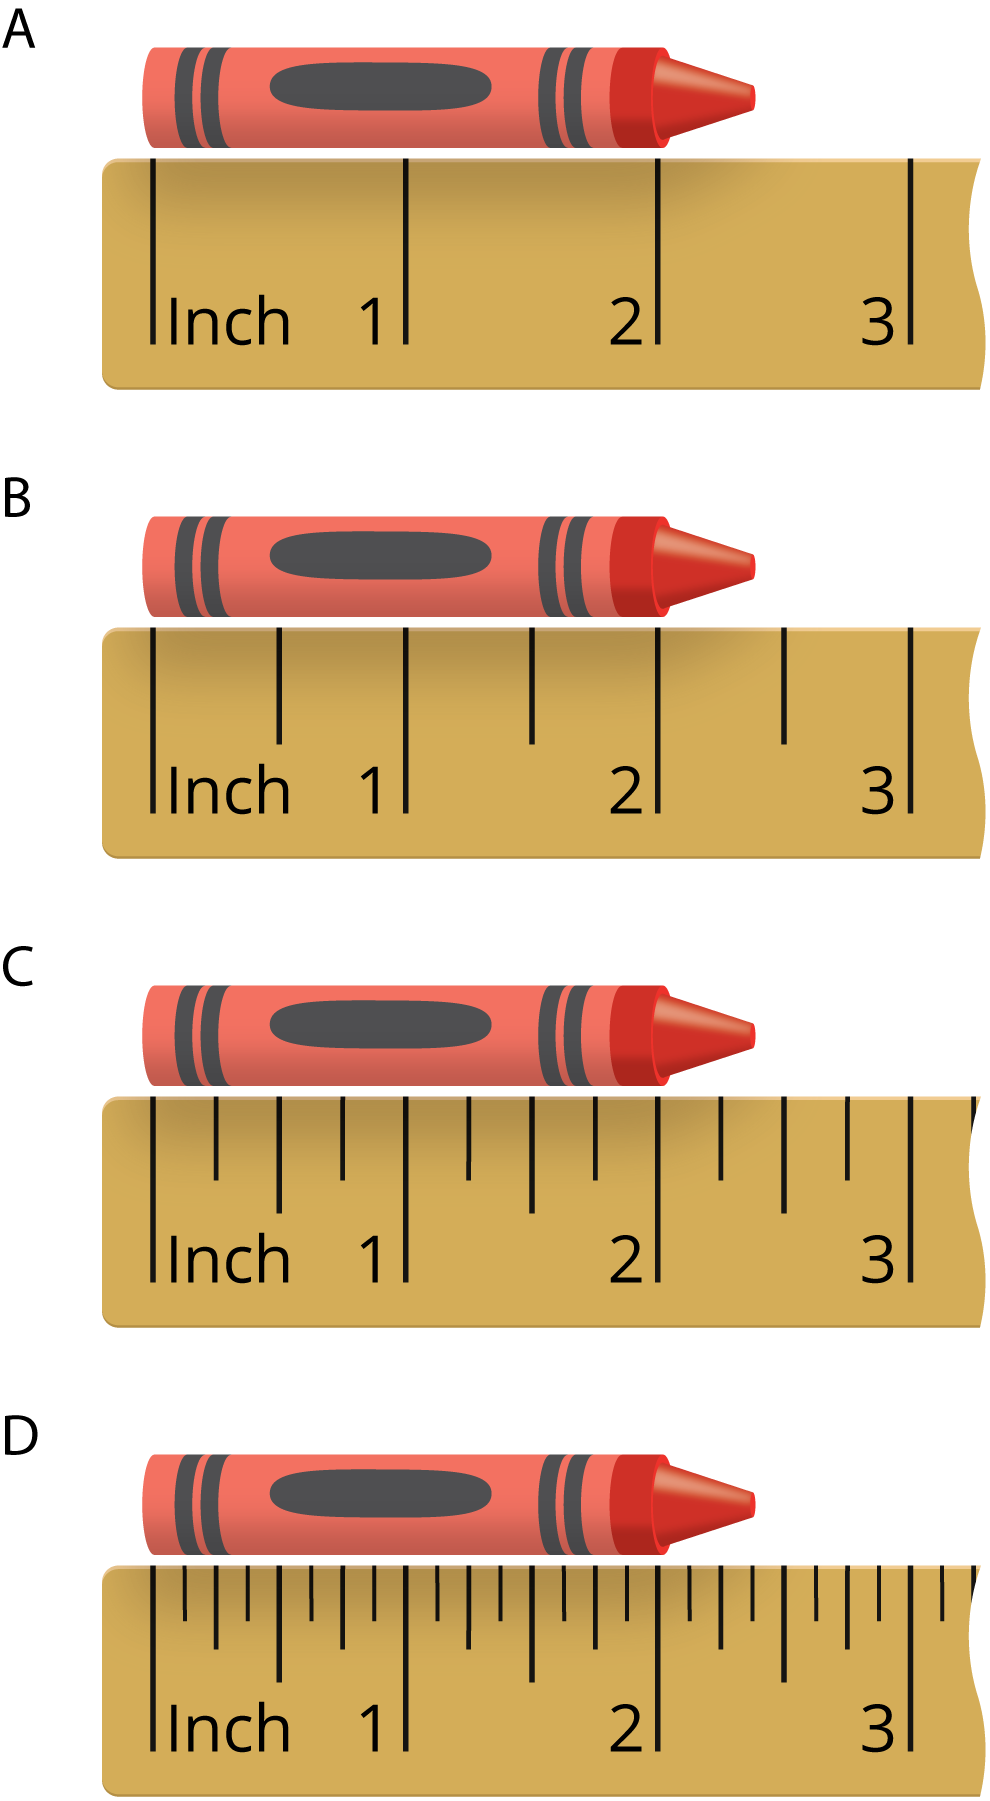
The purpose of this warm-up is to elicit ideas that students have about rulers and measurements of \(\frac{1}{2}\), \(\frac{1}{4}\), and \(\frac{1}{8}\), which will be useful when students measure objects and generate and analyze line plots in a later activity. While students may notice and wonder many things about the images, focus the discussion on how to name the fractional measures in each image and the progression of the different levels of precision.
Launch
- Groups of 2
- Display the image.
- “What do you notice? What do you wonder?”
- 1 minute: quiet think time
Activity
- “Discuss your thinking with your partner.”
- 1 minute: partner discussion
- Share and record responses.
Student Facing
What do you notice? What do you wonder?
Student Response
For access, consult one of our IM Certified Partners.
Activity Synthesis
- “Why does the crayon measurement change each time?” (Sample responses: The crayon is not changing. The measurements on the ruler are becoming more precise. We’re using smaller and smaller pieces to measure the crayon.)
- “What do you think the tick marks on each ruler represent?” (They represent inches, halves, fourths, and eighths of an inch.)
- “What are some things that you would measure with the first ruler? What about things you would measure with the last ruler? Why might that be?” (Sample response: I would use the first ruler if the measurement doesn’t need to be exact and use the last ruler if it needs to be pretty exact.)
Activity 1: Measure to the Nearest $\frac{1}{4}$ and $\frac{1}{8}$ Inch [OPTIONAL] (25 minutes)
Narrative
In this activity, students first measure colored pencils to the nearest \(\frac{1}{4}\) inch, collect a set of data in a table, and then plot them on a line plot. Then, they measure the colored pencils again, but this time to the nearest \(\frac{1}{8}\) inch. They plot their data on a new number line and attend to a greater level of precision as they do so. Students then reflect on the difference in the measuring process and in the measurements on the same set of pencils. Students attend to precision when they measure the pencils to the appropriate fractional unit (MP6).
Required Materials
Materials to Gather
Required Preparation
- Each student needs a used colored pencil.
Launch
- Groups of 5
- Give a used colored pencil to each student.
- Prepare a number line on a poster and display it for students to see. Label the tick marks with whole numbers.
- “If we wanted to make a line plot and show measurements to the nearest \(\frac{1}{4}\) inch, what else might we do that would be helpful?” (Partition the space between two consecutive whole numbers into 4 equal parts.)
- Partition the number line in increments of \(\frac{1}{4}\).
- “What if we wanted to show measurements that include \(\frac{1}{8}\) inch?” (Partition the space between two whole numbers into 8 equal parts.)
Activity
- “Work with your group to measure colored pencils to the nearest \(\frac{1}{4}\) inch. Record your measurements in the first table and then plot them on the first line plot.”
- 5–7 minutes: group work time
- “Now measure the pencils again, but this time to the nearest \(\frac{1}{8}\) inch. Record your measurements in the second table and then plot the new data on the second line plot.”
-
5–7 minutes: group work time
Student Facing
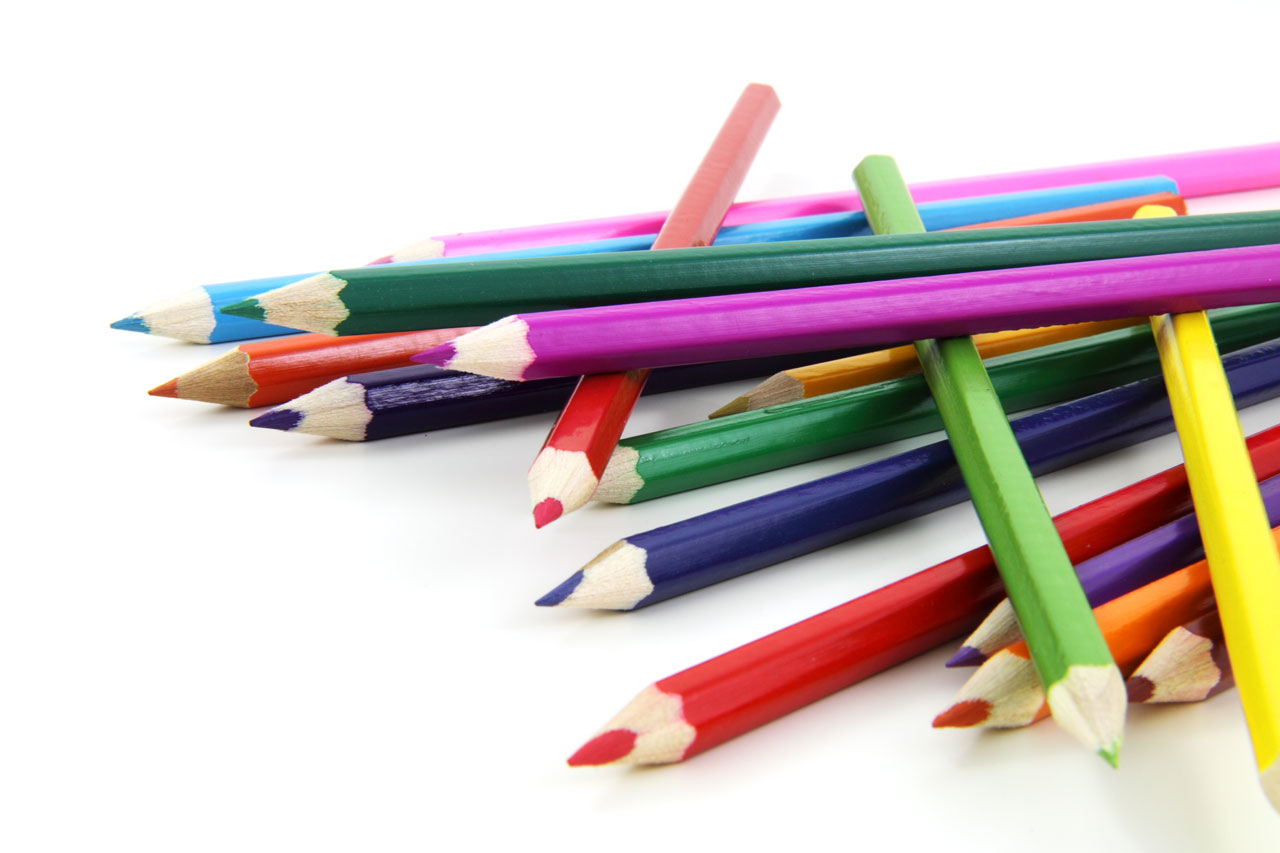
Your teacher will give your group a set of colored pencils.
- Work with your group to measure each colored pencil to the nearest \(\frac{1}{4}\) inch. Check each other’s measurements. Record each measurement in the table.
group members pencil length (inches) 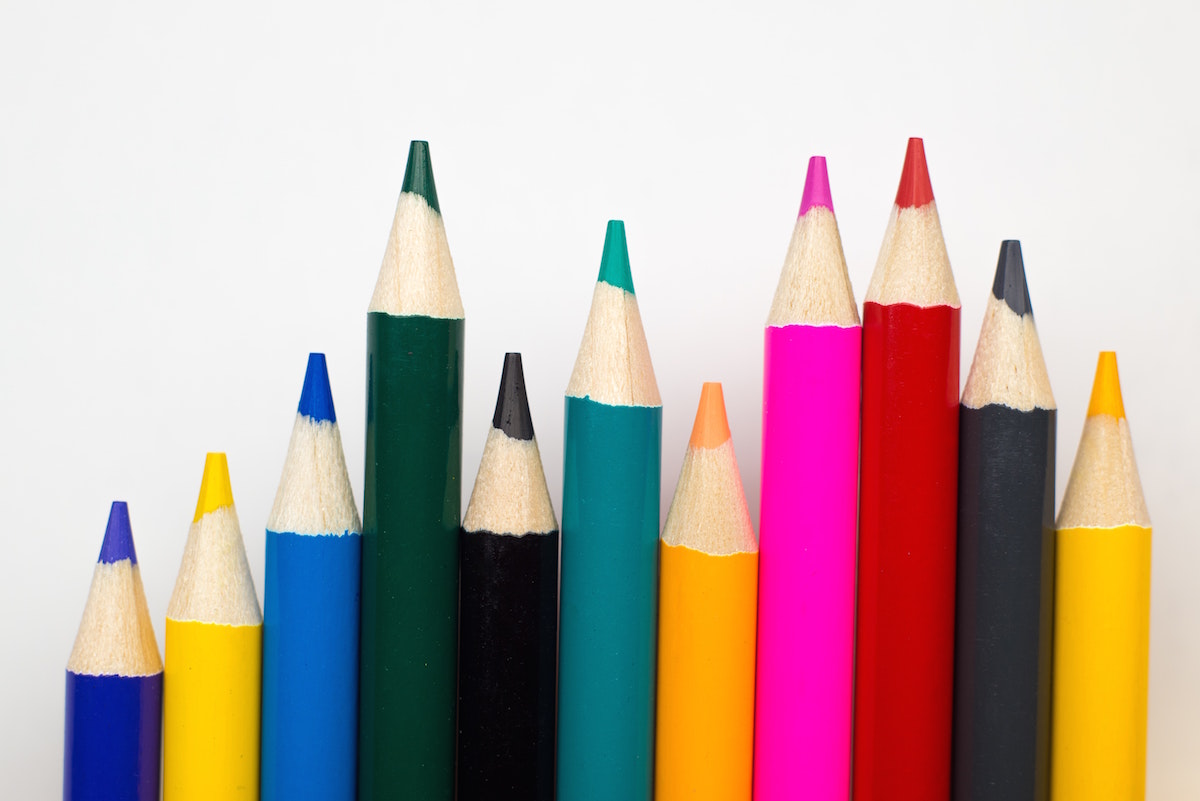
-
Create a line plot to represent the data your group collected.

-
Work with your group to measure each colored pencil to the nearest \(\frac{1}{8}\) inch.
Check one another’s measurements. Record each measurement in the table.
group members pencil length (inches) -
Create a line plot to represent your new data.

- How was measuring to the nearest \(\frac{1}{4}\) inch different from measuring to the nearest \(\frac{1}{8}\) inch?
Student Response
For access, consult one of our IM Certified Partners.
Advancing Student Thinking
Activity Synthesis
- Allow students to record their two sets of data on two different class line plots. (If dot stickers are available, consider using them—one sticker for each data point.)
- “How did your data and line plots change when you measured colored pencils to the nearest \(\frac{1}{8}\) inch?” (Sample responses:
- We got different numbers.
- The marks or points on the line plots are distributed differently. The points for some of the same pencils show up as different lengths in the second line plot.)
- “What is challenging about measuring to the nearest \(\frac{1}{8}\) inch?” (The tick marks are smaller and harder to see on the ruler.)
- “Why do you think we measure to the nearest \(\frac{1}{8}\) inch?” (We measure to be more accurate.)
- “Let’s look at some other length data with measurements in halves, fourths and eighths of an inch.”
Activity 2: Colored-pencil Measurements (20 minutes)
Narrative
In this activity, students create a line plot using measurements to the nearest \(\frac{1}{4}\) and \(\frac{1}{8}\) inch. This task prompts students to use their understanding of fraction equivalence to plot and partition the horizontal axis.
Supports accessibility for: Conceptual Processing, Visual-Spatial Processing
Launch
- Groups of 2
- “The table lists many different lengths.”
- “What do you notice about the pencil lengths?” (Sample responses:
- Some repeat more than one time.
- The numbers are mixed numbers.
- There are no whole numbers.)
- 1 minute: quiet think time
- “There are some lengths that are more common or occur more often than others.”
- “Tell a partner the length that is most common.” (\(6\frac{3}{4}\))
Activity
- Groups of 2
- 5 minutes: independent work time
- Monitor for students who use equivalence to plot measurements to the nearest eighth inch.
- “Share your line plots with your partner and make revisions as needed.”
- 2 minutes: partner discussion
Student Facing
-
Andre’s class measured the length of some colored pencils to the nearest \(\frac{1}{4}\) inch. The data are shown here:
- \(1\frac{3}{4}\)
- \(2\frac{1}{4}\)
- \(5\frac{1}{4}\)
- \(5\frac{1}{4}\)
- \(4\frac{2}{4}\)
- \(4\frac{2}{4}\)
- \(6\frac{1}{4}\)
- \(6\frac{3}{4}\)
- \(6\frac{3}{4}\)
- \(6\frac{3}{4}\)
-
Plot the colored-pencil data on the line plot.

- Which colored-pencil length is the most common in the data set?
- Write 2 new questions that could be answered using the line plot data.
-
Next, Andre’s class measured their colored pencils to the nearest \(\frac{1}{8}\) inch. The data are shown here:
- \(1\frac{6}{8}\)
- \(2\frac{2}{8}\)
- \(5\frac{2}{8}\)
- \(5\frac{3}{8}\)
- \(4\frac{4}{8}\)
- \(4\frac{4}{8}\)
- \(6\frac{6}{8}\)
- \(6\frac{6}{8}\)
- \(6\frac{6}{8}\)
- \(6\frac{3}{8}\)
-
Plot the colored-pencil data on the line plot.
- Which colored-pencil length is the most common in the line plot?
- Why did some colored-pencil lengths change on this line plot?
- What is the difference between the length of the longest colored pencil and the shortest colored pencil? Show your reasoning.
Student Response
For access, consult one of our IM Certified Partners.
Advancing Student Thinking
Activity Synthesis
- “How many colored pencils were measured in Andre’s class?” (10, because there were ten data points and each represented a pencil that was measured.)
- “What was the most common measurement in the first set of data? In the second set of data?” (In the first set of data: \(6\frac{3}{4}\) inches. In the second set of data: \(6\frac{6}{8}\)inches.)
- “How did you use equivalence to help as you plotted measurement data in eighths of an inch?” (I know that two eighths are equivalent to one fourth and this helped to find eighths on the line plots.)
- Use the line plot image to clearly label \(\frac{1}{2}\), \(\frac{1}{4}\) and \(\frac{1}{8}\) with help from students.
Activity 3: Noah's Colored Pencils (15 minutes)
Narrative
In this activity, students continue to analyze line plot data and use the data to answer questions. Each data set involves lengths measured to the nearest \(\frac{1}{4}\) and \(\frac{1}{8}\) inch. As students organize and analyze data, they revisit ideas about fraction equivalence and addition and subtraction of fractions. When students relate the data to the context it represents and carefully interpret the elements of a graph, they reason abstractly and quantitatively and attend to precision (MP2, MP6).
Advances: Representing, Conversing
Launch
- Groups of 2
- “Take a look at the line plot. Think of a couple of things that you know to be true about Noah’s colored pencils based on the data you see.”
- 1 minute: quiet think time
- Invite 2–3 students to share their responses.
Activity
- “Take a few minutes to work on your own before sharing ideas with your partner.”
- 5 minutes: independent work time
- 5 minutes: partner work time
- Monitor for students who:
- decompose the mixed numbers to find the difference between the longest and shortest points of data
- recognize and label eighths on the number line as the halfway points between consecutive fourths
Student Facing
The line plot shows the data Noah collected on a set of colored pencils.

- Noah measured the colored pencils to the nearest \(\frac{1}{2}\) inch.
- There are five pencils that are \(6\frac{1}{4}\) inches long.
- The shortest pencil is \(1\frac{3}{4}\) inches long.
- The three longest pencils are exactly 5 inches longer than the shortest one.
- If Noah removed the shortest pencil from the collection, the difference between the longest and shortest pencils would be 3 inches.
If You Have Time
Noah wants to create a collection of at least 10 pencils where the difference between the longest and shortest colored pencils is no more than \(1\frac{1}{2}\) inches.
Is that possible? If so, which pencils should he remove from his collection?
Student Response
For access, consult one of our IM Certified Partners.
Activity Synthesis
- Select students to share strategies for finding the difference between the longest and shortest lengths?
- Make connections between strategies, being sure to emphasize strategies that involve decomposing fractions in different ways.
- Consider asking: “What are the similarities between these strategies?”
Lesson Synthesis
Lesson Synthesis
“Today we organized data on line plots and answered questions about the data.”
“How did you compare the data points or use them to answer questions when the data were fractions with different denominators?” (We used equivalence to relate them. We knew the relationship between halves, fourths, and eighths.)
“How could we find the difference between the longest and shortest colored pencils from the last line plot?” (The leftmost point represents the shortest pencil, the rightmost point represents the longest. We could use the marks on the number line to count up or down to find the difference, or we can subtract the two fractions.)
Cool-down: Jada’s Pencil Data (5 minutes)
Cool-Down
For access, consult one of our IM Certified Partners.