Lesson 14
What is a Line Plot?
Warm-up: Notice and Wonder: “Handy” Graphs (10 minutes)
Narrative
Launch
- Groups of 2
- Display the image.
- “What do you notice? What do you wonder?”
- 1 minute: quiet think time
Activity
- “Discuss your thinking with your partner.”
- 1 minute: partner discussion
- Share and record responses.
Student Facing
What do you notice? What do you wonder?


Student Response
For access, consult one of our IM Certified Partners.
Activity Synthesis
- “What are these two graphs about? How do you know?” (One graph is about the size of gloves. The other graph is about hand spans. I can tell from the title and labels on the graphs.)
- As needed, clarify the meaning of hand span.
- “Today we are going to learn a new way to display data that is collected by measuring the lengths of objects. You are going to get a chance to measure your own hand spans and create a class data display.”
Activity 1: Measure Our Hand Spans (20 minutes)
Narrative
The purpose of this activity is for students to generate numerical data by measuring their hand spans in inches. Students trace their hands and measure their hand spans (the length from the tip of the pinky to the tip of the thumb). The student-generated data is used to demonstrate creating a line plot, as they work collectively to represent their hand spans measured in inches. Students add a representation of the length of their hand spans by drawing an x on a sticky note and adding it to the line plot. They make sense of the way the line plot represents a number of measurements and the size of each measurement (MP2). The class line plot will be used in the next activity to discuss the purpose and features of a line plot.
Supports accessibility for: Attention
Required Materials
Materials to Gather
Required Preparation
- Create a blank line plot with a scale from 0 to 10 for students to place their measurements on.
- Ensure the tick marks are equally spaced with enough room for students to place their sticky notes.
Launch
- Groups of 2
- Give students 12-inch rulers.
Activity
- “We are going to continue measuring in inches. Each of you will measure your hand span.”
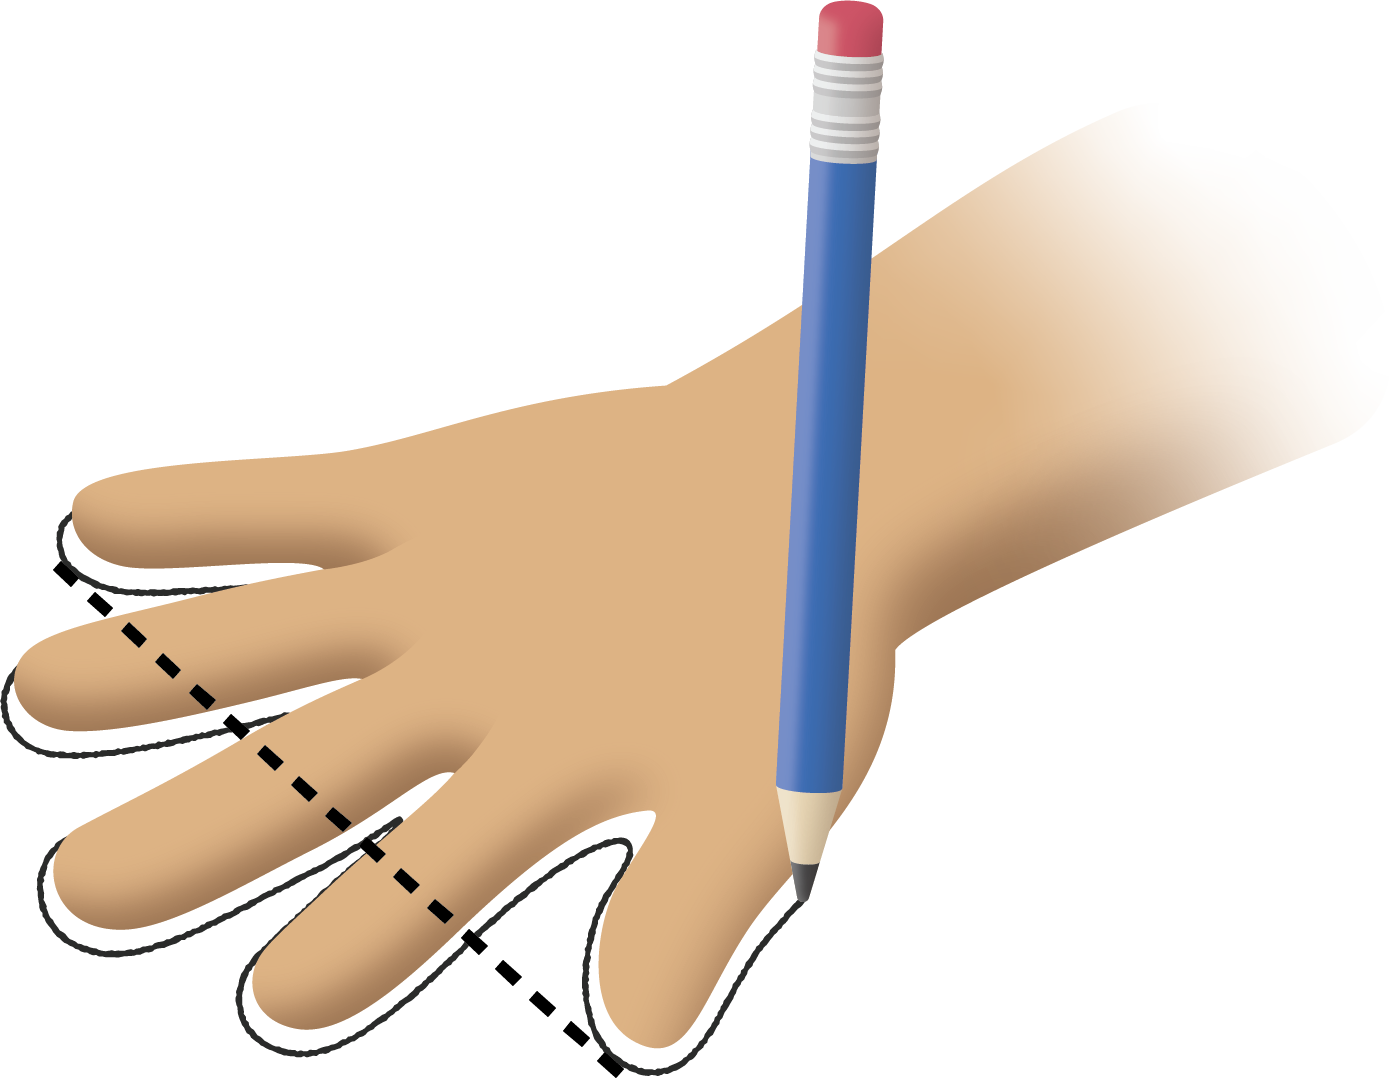
- Display the image of the traced hand.
- “You are going to measure your hand span, which is the length from your pinky to your thumb. First, you’ll trace your hand and then measure it to the nearest inch.”
- “After measuring your own hand span, check your partner’s measurements.”
- 6 minutes: partner work time
- “Now, we are going to make a representation to show everyone’s hand span measurements.”
- Give each student a sticky note that is the same size.
- “Now we need to represent the data we have collected. Draw a big x on your sticky note.”
- As needed, demonstrate drawing an x on a sticky note.
- Display the blank line plot.
- ”If we want this display to show others the lengths of all our measurements, where do you think the length of your hand span should go?”
- 30 seconds: quiet think time
- 1 minute: partner discussion
- Invite students to come up to add their sticky notes to the chart above the corresponding measurement.
- Consider asking students to explain how they place their sticky notes.
Student Facing
- Trace your hand. (Spread your fingers wide.)
- Draw a line from your thumb to your pinky. This line represents your hand span. Measure the length of your hand span in inches.
My hand span is ____________ inches.
Student Response
For access, consult one of our IM Certified Partners.
Activity Synthesis
- “We just made a line plot. A line plot is a way to show how many of each measurement using an x for each measurement. The line and the numbers on it represent the units you used to measure. The line should look like the numbers on the tool you use to measure.”
- “What does each x on the line plot represent?” (Each x represents a measurement of a student hand span.)
- “What does the total number of Xs represent?” (Everybody's measurement. Its the same number as the number of people in our class today.)
- As needed, “The total number of Xs represents the total number of measurements. They don't have to each be done by different people.”
- “How many measurements did we collect for our line plot? Explain how you see the data.”
- 1 minute: quiet think time
- 1 minute: partner discussion
- Share responses.
Activity 2: Interpret Our Numerical Data (15 minutes)
Narrative
The purpose of this activity is for students to interpret data represented in a line plot. They engage in a discussion about what they notice and how a line plot can be used to interpret data. After highlighting the features of a line plot, students answer questions about the lengths of students’ hand spans. In the synthesis, the importance of making Xs the same size in order to accurately reflect our data is stressed (MP6), as students will create their own line plots in later lessons.
Advances: Speaking
Launch
- Display the class line plot.
- “We just represented the data we collected, but if someone else looks at it, it is not clear what this line plot is about.”
- “We know graphs need a title. What could be a good title for this data?” (Class hand spans)
- 1 minute: quiet think time
- Share responses and record a title.
- “When we made picture graphs and bar graphs we labeled the categories so others would know what each group of pictures or each bar represented.”
- “What do the numbers on our line plot represent? What does the way the numbers are arranged remind you of?” (The numbers represent lengths in inches. It reminds of a ruler. It has tick marks and each tick mark is the same length apart.)
- “The line on a line plot represents the unit you use to measure. It shows numbers in order and the same length apart, just like on a ruler.”
- “What length unit do the numbers on our line plot represent? How could we label this?” (The lengths of our hand spans in inches. “measurement in inches”)
- 1 minute: quiet think time
- Share responses and record a label.
- “The length of the line between two numbers do not have to match the unit you used, so it's important to label the line on the line plot with the unit.”
Activity
- “We have used graphs to answer questions. Now, you will use this line plot to answer questions based on our class data representing hand spans. Think about what the Xs represent as you answer each question. Make sure you record the unit in your answers.”
- 3–4 minutes: independent work time
Student Facing
- What was the longest hand span?
- What was the shortest hand span?
- Write another statement about our class’ hand spans based on the line plot.
Student Response
For access, consult one of our IM Certified Partners.
Advancing Student Thinking
- “Where do you see the lengths of hand spans in the line plot?”
- “What does the number of Xs above a number tell us?”
Activity Synthesis
- Invite students to share the longest and shortest hand span and how they used the line plot.
- Invite 3–4 students to share the statements they wrote about the data.
- Consider asking:
- “Which hand span length was most common?” (The measurement that has the most Xs represents the length that was most common in our class. This is different from having the most votes. _____ inches was the most common measurement.)
- “What is a measurement that no one in our class had for their hand span?” (Any number with no Xs.)
Lesson Synthesis
Lesson Synthesis
“Today we learned a new way to display data—a line plot.”
Display the images from the warm up.


“What is the same and different about the bar graphs and line plots?”
“What do the numbers tell us in each graph?”
Sample Responses:
Same:
- Both are graphs and have numbers.
- Both give us information (data).
- The numbers go by ones.
- The bars or the Xs go up in the graphs.
Different:
- One graph is about glove sizes and the other is about hand span.
- One has bars and the other has Xs.
- The bar graph has 3 bars.
- There are Xs in five different numbers on the number line.
- In the bar graph, numbers are on the side. In the line plot, the numbers are on the bottom.
The numbers in the Glove Size graph tell us how many people have each of the glove sizes.
The numbers in the hand span line plot tell us the length in inches of people’s hand spans.
Cool-down: Hand Spans (5 minutes)
Cool-Down
For access, consult one of our IM Certified Partners.