Lesson 9
What Makes a Good Sample?
Lesson Narrative
In this lesson, students examine multiple samples of the same population and learn what it means for a sample to be representative of the population. Students look at the structure of dot plots, attending to center, shape, and spread, to help them compare the samples and the population (MP7). Although the previous lesson pointed out the usefulness of using samples when working with large populations, the problems in this lesson use smaller populations so that students can compare each sample against the entire population.
Learning Goals
Teacher Facing
- Calculate the mean or median of various samples, and compare them with the mean or median of the population.
- Comprehend that the term “representative” (in spoken and written language) refers to a sample with a distribution that closely resembles the population’s shape, center, and spread.
- Given dot plots, determine whether a sample is representative of the population, and explain (orally and in writing) the reasoning.
Student Facing
Let’s see what makes a good sample.
Required Materials
Learning Targets
Student Facing
- I can determine whether a sample is representative of a population by considering the shape, center, and spread of each of them.
- I know that some samples may represent the population better than others.
- I remember that when a distribution is not symmetric, the median is a better estimate of a typical value than the mean.
Glossary Entries
-
representative
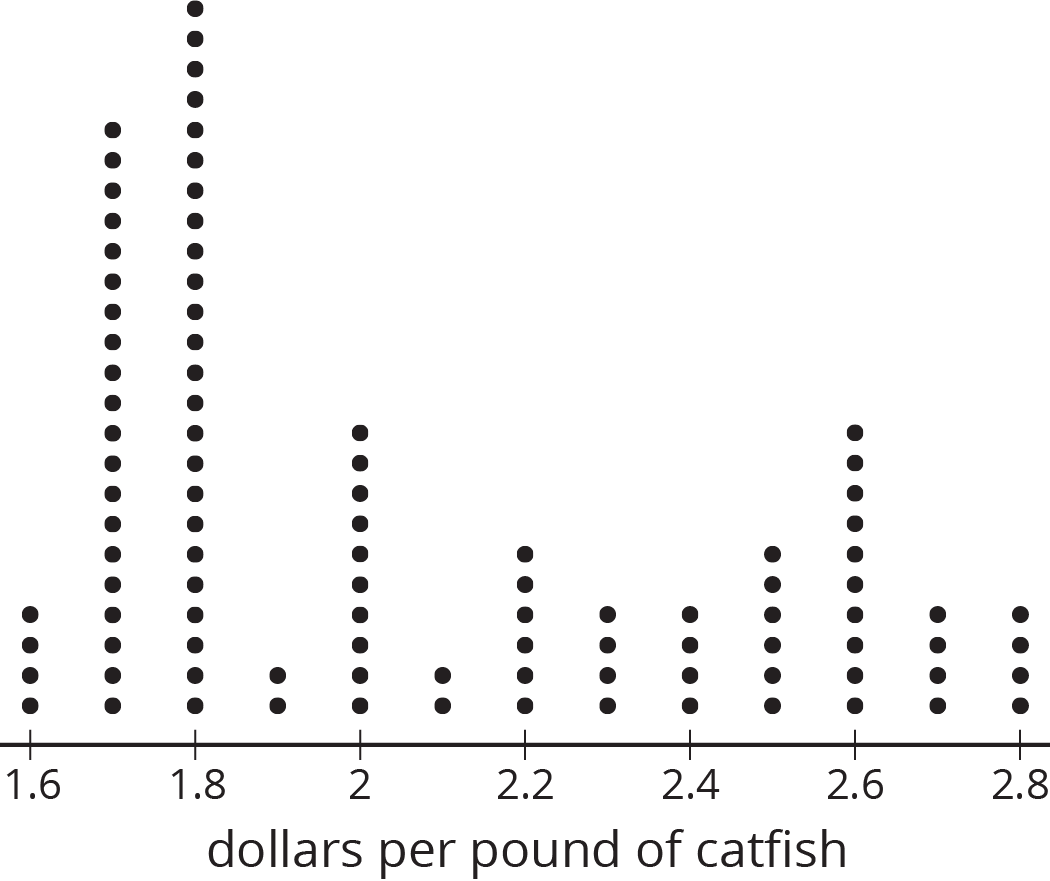
A sample is representative of a population if its distribution resembles the population's distribution in center, shape, and spread.
For example, this dot plot represents a population.

This dot plot shows a sample that is representative of the population.

Print Formatted Materials
For access, consult one of our IM Certified Partners.
Additional Resources
| Google Slides | For access, consult one of our IM Certified Partners. |
|
| PowerPoint Slides | For access, consult one of our IM Certified Partners. |