Lesson 3
More Costs of Running a Restaurant
3.1: Are We Making Money? (20 minutes)
Optional activity
The purpose of this activity is for students to choose how they can apply math concepts and strategies to a problem arising in a real-world context: predicting whether a restaurant will make a profit.
After students have estimated the monthly cost of their ongoing expenses on their list, poll the class on their total estimated monthly costs.
If students have completed the previous lesson about using spreadsheets to calculate the cost of ingredients for one serving of their recipe, they can use that as the basis for calculating the percentage of the markup. If students have not calculated the cost of ingredients in a previous lesson, then tell students that the ingredients for one serving of a meal typically cost about:
- $2 for a fast-food restaurant
- $5 for a casual sit-down restaurant
- $10 to $25 for a formal sit-down restaurant
Launch
Point out that restaurants have many more expenses than just the cost of the food. Give students quiet work time followed by partner discussion.
Consider having students pause their work after the first question so that you can record their answers displayed for all to see, and all students will have access to this same information for the rest of the activity.
Design Principle(s): Optimize output (for explanation); Cultivate conversation
Student Facing
-
Restaurants have many more expenses than just the cost of the food.
-
Make a list of other items you would have to spend money on if you were running a restaurant.
-
Identify which expenses on your list depend on the number of meals ordered and which are independent of the number of meals ordered.
-
Identify which of the expenses that are independent of the number of meals ordered only have to be paid once and which are ongoing.
-
Estimate the monthly cost for each of the ongoing expenses on your list. Next, calculate the total of these monthly expenses.
-
-
Tell whether each restaurant is making a profit or losing money if they have to pay the amount you predicted in ongoing expenses per month. Organize your thinking so it can be followed by others.
- Restaurant A sells 6,000 meals in one month, at an average price of $17 per meal and an average cost of $4.60 per meal.
- Restaurant B sells 8,500 meals in one month, at an average price of $8 per meal and an average cost of $2.20 per meal.
- Restaurant C sells 4,800 meals in one month, at an average price of $29 per meal and an average cost of $6.90 per meal.
-
-
Predict how many meals your restaurant would sell in one month.
- How much money would you need to charge for each meal to be able to cover all the ongoing costs of running a restaurant?
-
-
What percentage of the cost of the ingredients is the markup on your meal?
Student Response
For access, consult one of our IM Certified Partners.
Activity Synthesis
Poll the class on whether they think each of the restaurants A, B, and C made money for the month. Select students to share their reasoning.
Note: The way the problem is written, there is not just one correct answer to the question. Whether or not each restaurant made money depends on how much the students estimated for the total monthly expenses (excluding food).
| if students estimated the total ongoing expenses (excluding food) to be: | restaurants that would have made money | restaurants that would have lost money |
|---|---|---|
| below $49,300 | A, B, and C | none |
| between $49,300 and $74,400 | A and C | B |
| between $74,400 and $106,080 | C | A and B |
| above $106,080 | none | A, B, and C |
Next, ask students to trade with a partner, and check their work for calculating the percentage of the mark up.
Ask students to discuss:
- “How does the amount you plan to charge for each meal compare to your partner’s amount?”
- “How does your mark up percentage compare to your partner’s percentage?”
Consider telling students that many restaurant owners use 300% as an estimate of a good percentage for the mark up on their meals to be able to make a profit. That means the price of the meal is 4 times what the cost of the ingredients were.
3.2: Disposable or Reusable? (20 minutes)
Optional activity
The purpose of this activity is for students to write and solve equations as a strategy to compare the projected costs of using reusable versus disposable plates and forks. First, students examine dot plots representing the average number of customers served per day at a sample of restaurants to make a prediction about how many customers they might serve per day. Then, students see that the cost of buying disposable plates and forks can be modeled with a proportional relationship, while the cost of buying and washing reusable plates and forks can be modeled with an equation in the form \(px+q=r\).
Launch
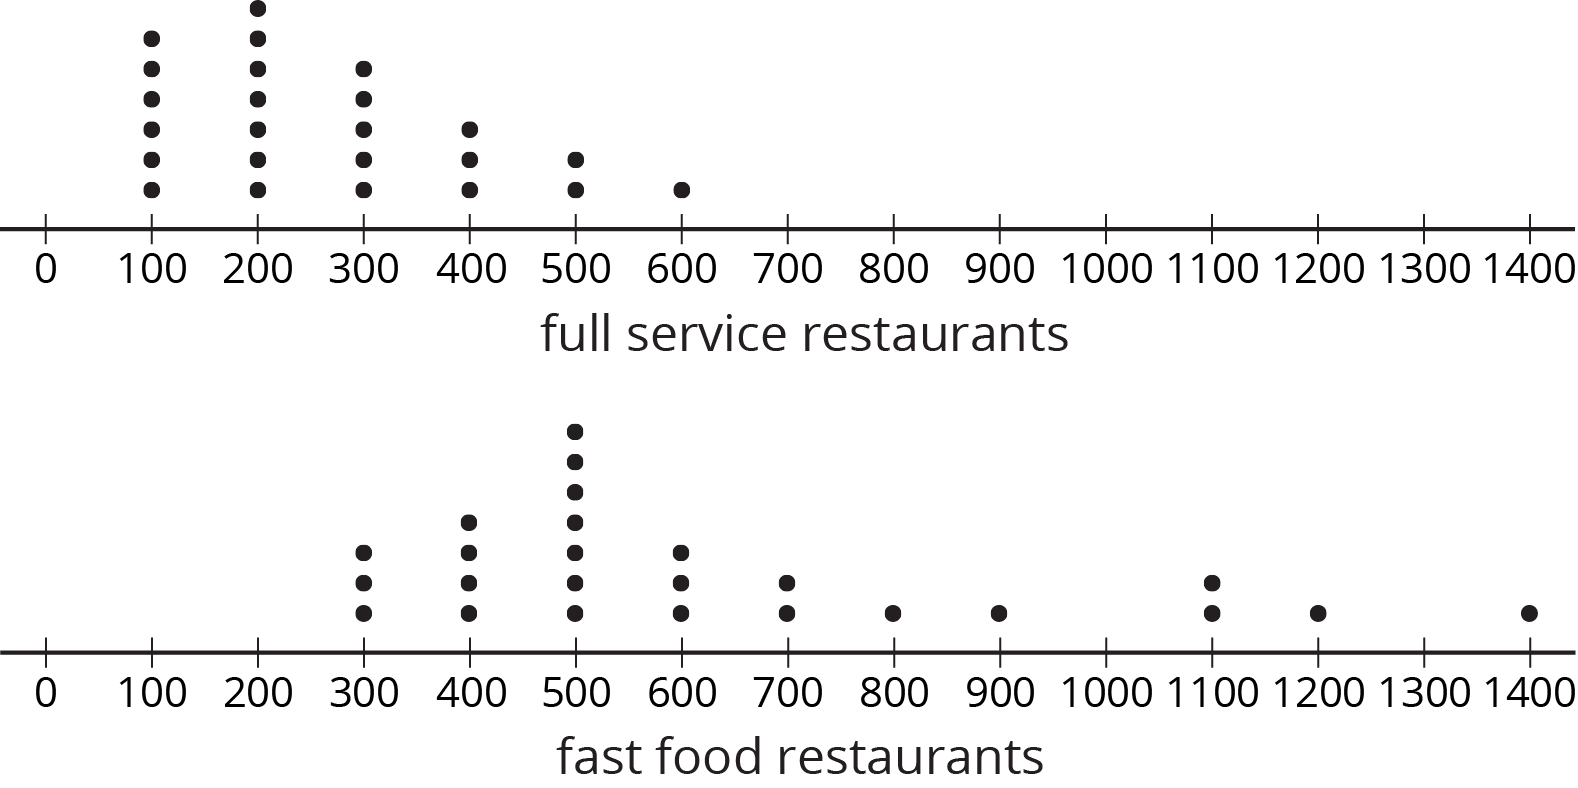
Display the dot plots about the number of customers served per day. Invite students to share what they notice and wonder.
Some things students may notice:
- Many of the fast food restaurants serve more customers per day than the full service restaurants.
- There is a lot of overlap between the two distributions, from 300 to 600 customers.
Some things students may wonder:
- Were the restaurants included in the samples selected at random?
- Is there a meaningful difference between the average number of customers served at these two types of restaurants?
- About how many customers would my restaurant serve per day?
Give students quiet work time followed by whole-class discussion.
Supports accessibility for: Organization; Attention
Student Facing
A sample of full service restaurants and a sample of fast food restaurants were surveyed about the average number of customers they serve per day.
-
How does the average number of customers served per day at a full service restaurant generally compare to the number served at a fast food restaurant? Explain your reasoning.
- About how many customers do you think your restaurant will serve per day? Explain your reasoning.
-
Here are prices for plates and forks:
plates forks disposable 165 paper plates for $12.50 600 plastic forks for $10 reusable 12 ceramic plates for $28.80 24 metal forks for $30 -
Using your predicted number of customers per day from the previous question, write an equation for the total cost, \(d\), of using disposable plates and forks for every customer for \(n\) days.
-
Is \(d\) proportional to \(n\)? Explain your reasoning.
-
Use your equation to predict the cost of using disposable plates and forks for 1 year. Explain any assumptions you make with this calculation.
-
-
- How much would it cost to buy enough reusable plates and forks for your predicted number of customers per day?
- If it costs $10.75 a day to wash the reusable plates and forks, write an expression that represents the total cost, \(r\), of buying and washing reusable plates and forks after \(n\) days.
-
Is \(r\) proportional to \(n\)? Explain your reasoning.
- How many days can you use the reusable plates and forks for the same cost that you calculated for using disposable plates and forks for 1 year?
Student Response
For access, consult one of our IM Certified Partners.
Activity Synthesis
Poll the class on how many days they can you use the reusable plates and forks for the same cost as using disposable plates and forks for 1 year. Select students to share what this tells us about the situation. (If their answer is greater than the number of days they planned for their restaurant to be open during the year, then this means that buying and washing reusable plates and forks is cheaper than using disposable plates and forks.)
Select students to share their reasoning about whether there is a proportional relationship between the cost of using disposable or reusable and the number of days.
Students might share the following ideas:
- The relationship for the cost of using disposable looks like it is proportional because we wrote it in the form \(y=kx\).
- The relationship for the cost of using disposable would be close, but not exactly proportional, because the equation is assuming an average number of customers per day and in real life the restaurant serves a different number of people each day.
- The relationship for the cost of using reusable is not proportional because:
- there is a start-up cost of buying the reusable plates and forks.
- the equation cannot be written in the form \(y=kx\). There has to be a term that is added that represents the start-up costs.
- if we graphed the relationship, it would not go through the origin, but would cross the y-axis at a point that represents the start-up costs.
Design Principle(s): Optimize output (for justification)