Lesson 8
Measurement Error (Part 1)
8.1: How Long Are These Pencils? (20 minutes)
Optional activity
In this activity, students measure lengths and determine possibilities for actual lengths. There are two layers of attending to precision (MP6) involved in this task:
- Deciding how accurately the pencils can be measured, probably to the nearest mm or to the nearest 2 mm, but this depends on the eyesight and confidence of the student
- Finding the possible percent error in the measurement chosen
Launch
Arrange students in groups of 2. Provide access to calculators. Give students 4–5 minutes of quiet work time, followed by partner and whole-class discussion.
Design Principle(s): Optimize output (for explanation)
Student Facing
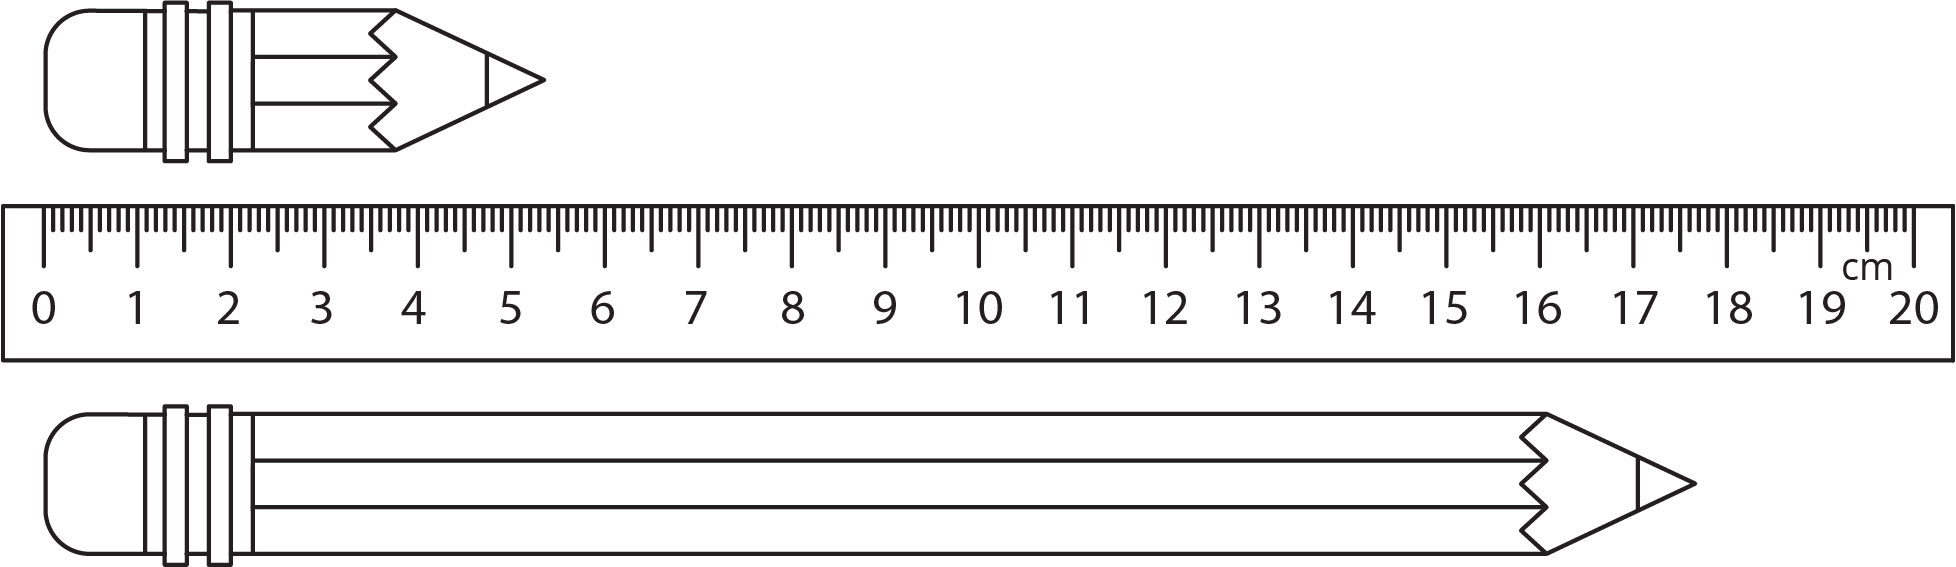
- Estimate the length of each pencil.
- How accurate are your estimates?
-
For each estimate, what is the largest possible percent error?
Student Response
For access, consult one of our IM Certified Partners.
Anticipated Misconceptions
Some students may think that they can find an exact value for the length of each pencil. Because the pictures of the pencils are far enough away from the ruler, it requires a lot of care just to identify the “nearest” millimeter (or which two millimeter markings the length lies between). Prompt them to consider the error in their measurements by asking questions like, “Assuming you measured the pencil accurately to the nearest millimeter, what is the longest the actual length of the pencil could be? What is the shortest it could be?”
Some students may not remember how to calculate percent error. Ask them, “What is the biggest difference possible between the estimated and actual lengths? What percentage of the actual length would that be when the difference is as big as possible?”
Activity Synthesis
The goal of this discussion is for students to practice how they talk about precision.
Discussion questions include:
- “How did you decide how accurately you can measure the pencils?” (I looked for a value that I was certain was less than the length of the pencil and a value that I was certain was bigger. My estimate was halfway in between.)
- “Were you sure which mm measurement the length is closest to?” (Answers vary. Possible responses: Yes, I could tell that the short pencil is closest to 5.4 cm. No, the long pencil looks to be closest to 17.7 mm, but I’m not sure. I am sure it is between 17.6 cm and 17.8 cm.)
- “Were the percent errors the same for the small pencil and for the long pencil? Why or why not?” (No. I was able to measure each pencil to within 1 mm. This is a smaller percentage of the longer pencil length than it is of the smaller pencil length.)
Other possible topics of conversation include noting that the level of accuracy of a measurement depends on the measuring device. If the ruler were marked in sixteenths of an inch, we would only be able to measure to the nearest sixteenth of an inch. If it were only marked in cm, we would only be able to measure to the nearest cm.
8.2: How Long Are These Floor Boards? (20 minutes)
Optional activity
This activity examines how measurement errors behave when they are added together. In other words, if I have a measurement \(m\) with a maximum error of 1% and a measurement \(n\) with a maximum error of 1%, what percent error can \(m + n\) have? In addition to examining accuracy of measurements carefully (MP6), students work through examples and look for patterns (MP8) in order to hypothesize, and eventually show, how percent error behaves when measurements with error are added to one another.
Monitor for students who look for patterns, recognize the usefulness of the distributive property, or formulate the problem abstractly with variables.
Launch
Read the problem out loud and ask students what information they would need to know to be able to solve the problem. Students may say that they need to know what length the boards are supposed to be, because it is likely that they haven't realized that they can solve the problem without this information. Explain that floor boards come in many possible lengths, that 18-inch and 36-inch lengths are both common, but the boards can be anywhere between 12 and 84 inches. Ask students to pick values for two actual lengths and figure out the error in that case. Then they can pick two different examples, make the calculations again, and look for patterns.
Provide access to calculators.
Supports accessibility for: Conceptual processing; Visual-spatial processing
Student Facing
A wood floor is made by laying multiple boards end to end. Each board is measured with a maximum percent error of 5%. What is the maximum percent error for the total length of the floor?
Student Response
For access, consult one of our IM Certified Partners.
Anticipated Misconceptions
Some students may pick some example lengths but then struggle with knowing what to do with them. Ask them “what would be the maximum measured lengths? The minimum? What would be the error if both measurements were maximum? What if they were both minimum?”
Some students may pick numbers that make the calculations more complicated, leading to arithmetic errors. Suggest that they choose simple, round numbers for lengths, like 50 inches or 100 centimeters.
Activity Synthesis
The goal of this discussion is for students to generalize from their specific examples of measurements to understand the general pattern and express it algebraically.
Poll the class on the measurements they tried and the maximum percent error they calculated. Invite students to share any patterns they noticed, especially students who recognized the usefulness of the distributive property for making sense of the general pattern.
Guide students to use variables to talk about the patterns more generally.
- If a board is supposed to have length \(x\) with a maximum percent error of 5%, then the shortest it could be is \(0.95x\) and the longest it could be is \(1.05x\).
- If another board is supposed to have length \(y\), it could be between \(0.95y\) and \(1.05y\).
- When the boards are laid end-to-end, the shortest the total length could be is \(0.95x + 0.95y\), which is equivalent to \(0.95(x + y)\).
- The longest the total length could be is \(1.05x + 1.05y\), or \(1.05(x + y)\).
- Because of the distributive property, we can see that the maximum percent error is still 5% after the board lengths are added together.
One interesting point to make, if students have also done the previous activity about measuring pencils, is that you could measure the sum of the board lengths with a lower percent error than you could measure each individual board (assuming your tape measure is long enough), just like an error of 1 mm was a smaller percentage of the length of the longer pencil.