Lesson 8
Rising and Falling
8.1: Notice and Wonder: A Bouncing Curve (5 minutes)
Warm-up
The purpose of this warm-up is to elicit the idea that some graphs have repeated behavior, which will be useful when students graph periodic motion in a later activity. While students may notice and wonder many things about the image, the repeating pattern of the outputs of the graph is the important discussion point.
Launch
Display the image for all to see. Ask students to think of at least one thing they notice and at least one thing they wonder. Give students 1 minute of quiet think time, and then 1 minute to discuss the things they notice and wonder with their partner, followed by a whole-class discussion.
Student Facing
What do you notice? What do you wonder?

Student Response
For access, consult one of our IM Certified Partners.
Activity Synthesis
Ask students to share the things they noticed and wondered. Record and display their responses for all to see. If possible, record the relevant reasoning on or near the image. After all responses have been recorded without commentary or editing, ask students, “Is there anything on this list that you are wondering about now?” Encourage students to respectfully disagree, ask for clarification, or point out contradicting information.
If the repetitive behavior of the graph does not come up during the conversation, ask students to discuss this idea. If none of the students notice or wonder anything about repeating, here are some possible prompts for discussion:
- “How would you describe the graph to someone who cannot see it?”
- “Are there any parts of this graph that happen more than once?”
- “Does anyone notice anything that repeats?”
8.2: What is Happening? (15 minutes)
Activity
In this activity, students examine relationships shown in graphs. They consider different types of events that cause repeated outputs (MP2). They examine one situation which is periodic (the distance of a car from the start line as it goes around a racetrack) and two situations which are not periodic, but do rise and fall at regular intervals. The long-term goal in this unit is to develop mathematical tools which can help model these complex phenomena.
Monitor for students who connect the repetitive nature of these graphs to the context of the clock hands or Ferris wheel from earlier lessons.
Launch
Supports accessibility for: Organization; Attention; Social-emotional skills
Student Facing
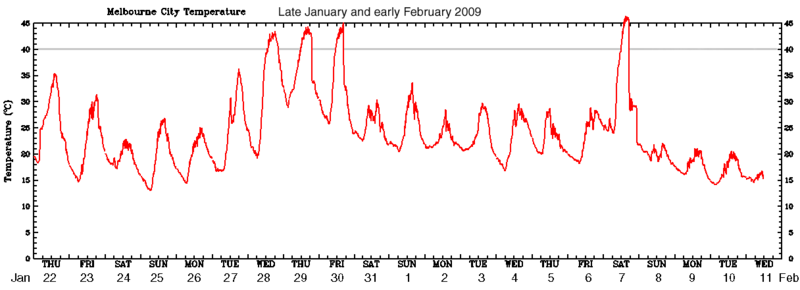
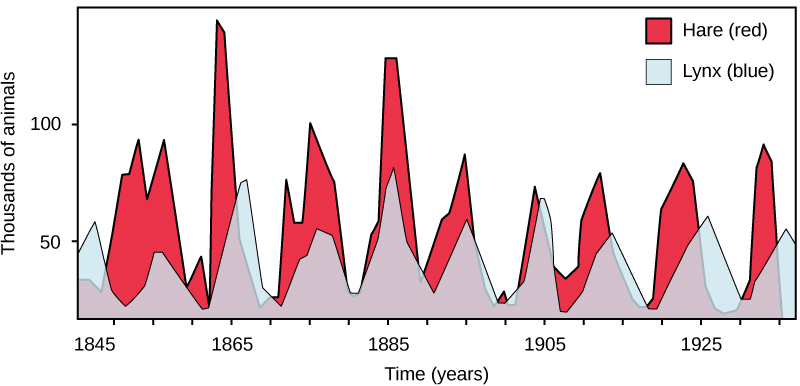
Here are some relationships that produce graphs that have a repetitive nature. For each situation, describe the dependent and independent variable. How does the dependent variable change? What might cause this change?
-
This is the graph of the distance of a race car from the starting line as it goes around a track.
-
This is the graph of the temperature in a city in Australia over 21 days.
-
This is the graph of two populations over time.
Student Response
For access, consult one of our IM Certified Partners.
Student Facing
Are you ready for more?
A ladybug is resting at the tip of a clock’s minute hand, which is 1 foot long. When it is 12:15, the ladybug is 10 feet above the ground.
- Calculate how far above the ground the ladybug is at 12:00, 12:30, 12:45, and 1:00.
- Estimate how far above the ground the ladybug is at 12:10, 12:20, and 12:40.
-
Plot the distances of the ladybug from the ground from 12:00 to 1:00.

- If the ladybug stays on the minute hand, predict how its distance from the ground will change over the next hour (from 1:00 to 2:00). What about from 2:00 to 3:00?
Student Response
For access, consult one of our IM Certified Partners.
Anticipated Misconceptions
Some students may be unsure how to read the axes for all but the first relationship, as they look different than what students have seen so far. Encourage these students to focus on a specific coordinate on a graph to help them make sense of the axis labels as a way to get started.
Activity Synthesis
Begin the discussion by selecting previously identified students to share their observations about connections between the repeating nature of these graphs and the clock hands or Ferris wheel contexts from earlier lessons. If no groups make this connection, invite students to do so now—for example, by comparing the period of the race car to the period of the minute hand on a clock or by contrasting how the height of a point on a Ferris wheel always moves between the same high and low while the city high and low temperatures change from day to day.
Display the graphs for all students to see. Here are some questions for discussion:
- “What similarities do you see between the graphs representing these situations?” (There are highs and lows in all the graphs, and these highs and lows come at pretty regular intervals.)
- “Do these graphs all represent functions? How can you tell?” (Yes, in these situations for each time, there is a single value.)
- “What do you think it means for a function to be periodic?” (The output values follow a repeating pattern.)
- “What other words could you use to describe this type of behavior?” (repeating, cyclic)
Conclude the discussion by reminding students that previously, we named functions whose values repeat at regular intervals periodic functions. The graph of the race track is an example of what a periodic function can look like. The other two situations shown, temperature and population over time, are not quite periodic functions since the output values are not the same over and over again, but they have a definite periodic pattern to them.
8.3: Card Sort: Graphs of Functions (15 minutes)
Activity
The purpose of this activity is for students to compare different function types with a focus on periodic and non-periodic functions. The card sort allows students to compare a variety of graphs, helping students to construct their understanding of what the graphs of periodic functions can look like in preparation for future lessons that focus on the graphs of cosine and sine.
Monitor for different ways groups choose to categorize the graphs, but especially for categories that distinguish between function types.
Launch
Arrange students in groups of 2. Tell them that in this activity, they will sort some cards into categories of their choosing. When they sort the graphs, they should work with their partner to come up with categories. Select 2–3 groups to share the categories they chose, then instruct students to choose new categories and sort their cards again.
Design Principle(s): Support sense-making; Maximize meta-awareness
Supports accessibility for: Language; Social-emotional skills
Student Facing
Your teacher will give you a set of cards that show graphs.
- Sort the cards into categories of your choosing. Be prepared to describe your categories.
Pause for a whole-class discussion. - Sort the cards into new categories in a different way. Be prepared to describe your new categories.
Student Response
For access, consult one of our IM Certified Partners.
Activity Synthesis
Select groups to share their categories and how they sorted their equations. You can choose as many different types of categories as time allows, but ensure that one set of categories distinguishes between function types (for example, linear, quadratic, exponential, periodic). Attend to the language that students use to describe their categories and graphs, giving them opportunities to describe their graphs more precisely. Highlight the use of terms like linear, exponential, quadratic, and periodic.
Lesson Synthesis
Lesson Synthesis
Tell students that any function that repeats its values at regular intervals is called a periodic function, not just functions about moving in circles like clock hands. Invite students to suggest situations that would have some kind of periodic graph like the examples discussed in the lesson. Ask, “What kinds of things cause values that repeat periodically?” (Height of the end of a clock hand over time, distance of the end of a clock hand from the center of the clock over time, sound waves, energy, or water use over the course of a year.) If time allows, invite students to sketch graphs to illustrate their thinking about the periodic nature of a situation.
8.4: Cool-down - Measuring the Hours (5 minutes)
Cool-Down
For access, consult one of our IM Certified Partners.
Student Lesson Summary
Student Facing
Many familiar things go through cycles:
- The sun (and the moon) rise and fall regularly each day.
- The seasons repeat regularly every year.
- Tides come in and go out at regular intervals.
Some of these kinds of events are measurable, and we can create functions to model and study them. For example, imagine there is a spot of paint on a bike tire with a 26 inch diameter. We can measure the height of the spot above the ground as the bike moves. Here is what a table and graph of the relationship between the distance the bike has traveled and the height of the spot would look like:
| distance bike travels (inches) |
height of paint spot (inches) |
|---|---|
| 0 | 0 |
| 10 | 3.66 |
| 20 | 12.58 |
| 30 | 21.74 |
| 40 | 25.97 |
| 50 | 22.90 |
| 60 | 14.26 |
| 70 | 4.90 |
| 80 | 0.11 |
| 90 | 2.57 |
| 100 | 10.91 |

We can make some observations about the situation using the graph. For example, the height of the paint spot will never be less than 0 or greater than 26. This makes sense for the situation since the tire will not go below ground, and it can only reach 26 inches high, the wheel’s diameter. The height of the paint spot will go up and down in a repeating pattern as the tire rotates. This kind of function is called periodic because it represents something that happens over a certain interval and then repeats.