Lesson 8
Rising and Falling
Let’s study graphs that repeat.
8.1: Notice and Wonder: A Bouncing Curve
What do you notice? What do you wonder?

8.2: What is Happening?
Here are some relationships that produce graphs that have a repetitive nature. For each situation, describe the dependent and independent variable. How does the dependent variable change? What might cause this change?
-
This is the graph of the distance of a race car from the starting line as it goes around a track.
-
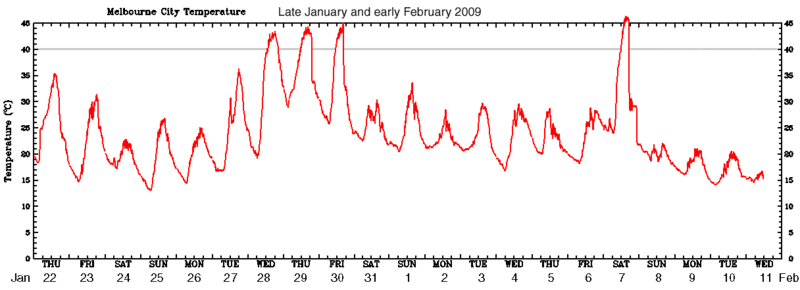
This is the graph of the temperature in a city in Australia over 21 days.
-
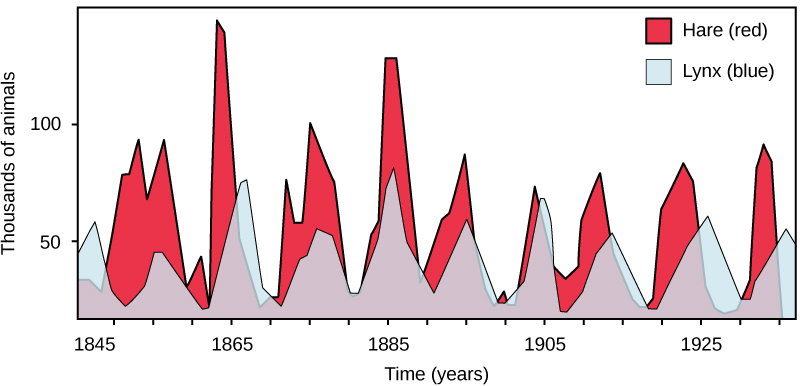
This is the graph of two populations over time.
A ladybug is resting at the tip of a clock’s minute hand, which is 1 foot long. When it is 12:15, the ladybug is 10 feet above the ground.
- Calculate how far above the ground the ladybug is at 12:00, 12:30, 12:45, and 1:00.
- Estimate how far above the ground the ladybug is at 12:10, 12:20, and 12:40.
-
Plot the distances of the ladybug from the ground from 12:00 to 1:00.

- If the ladybug stays on the minute hand, predict how its distance from the ground will change over the next hour (from 1:00 to 2:00). What about from 2:00 to 3:00?
8.3: Card Sort: Graphs of Functions
Your teacher will give you a set of cards that show graphs.
- Sort the cards into categories of your choosing. Be prepared to describe your categories.
Pause for a whole-class discussion. - Sort the cards into new categories in a different way. Be prepared to describe your new categories.
Summary
Many familiar things go through cycles:
- The sun (and the moon) rise and fall regularly each day.
- The seasons repeat regularly every year.
- Tides come in and go out at regular intervals.
Some of these kinds of events are measurable, and we can create functions to model and study them. For example, imagine there is a spot of paint on a bike tire with a 26 inch diameter. We can measure the height of the spot above the ground as the bike moves. Here is what a table and graph of the relationship between the distance the bike has traveled and the height of the spot would look like:
| distance bike travels (inches) |
height of paint spot (inches) |
|---|---|
| 0 | 0 |
| 10 | 3.66 |
| 20 | 12.58 |
| 30 | 21.74 |
| 40 | 25.97 |
| 50 | 22.90 |
| 60 | 14.26 |
| 70 | 4.90 |
| 80 | 0.11 |
| 90 | 2.57 |
| 100 | 10.91 |

We can make some observations about the situation using the graph. For example, the height of the paint spot will never be less than 0 or greater than 26. This makes sense for the situation since the tire will not go below ground, and it can only reach 26 inches high, the wheel’s diameter. The height of the paint spot will go up and down in a repeating pattern as the tire rotates. This kind of function is called periodic because it represents something that happens over a certain interval and then repeats.
Glossary Entries
- periodic function
A function whose values repeat at regular intervals. If \(f\) is a periodic function then there is a number \(p\), called the period, so that \(f(x + p) = f(x)\) for all inputs \(x\).
