Lesson 1
Interpreting Negative Numbers
1.1: Using the Thermometer (5 minutes)
Warm-up
The purpose of this warm-up is to remind students about negative numbers. The context of a weather thermometer works like a vertical number line. Students do not need to understand comparative temperatures in Celsius and Fahrenheit. The activity is written with temperatures in Celsius; however, the activity would work the same if the thermometer was labeled in Fahrenheit. These two different systems for measuring temperature is an opportunity to remind students that what counts as zero is abitrary and was chosen by someone as some point. If desired, explain to students that \(0^\circ\) Celsius is the freezing point of fresh water and \(0^\circ\) Fahrenheit is based on the freezing point of salt water.
Launch
Display the thermometer image for all to see. Explain that degrees Celsius is a way of measuring temperature, like degrees Fahrenheit—but it has a different zero point. Students may already know that \(0^\circ\) Celsius is based on the freezing point of water and \(0^\circ\) Fahrenheit on the freezing point of brine, but these were chosen by people; there’s no reason they had to be this way. Give students 1 minute of quiet think time to examine the picture before they start writing.
Student Facing
Here is a weather thermometer. Three of the numbers have been left off.

- What numbers go in the boxes?
- What temperature does the thermometer show?
Student Response
For access, consult one of our IM Certified Partners.
Anticipated Misconceptions
Some students may think the missing number between 0 and -10 needs to have a magnitude larger than -10, such as -15, because on the positive side of the number line, numbers increase in magnitude as you go up.
Activity Synthesis
Ask students to share their responses for the first question and explain their reasoning. After each response, ask students to indicate if they agree or disagree. If all students are in agreement, record and display the missing temperatures for all to see. If they disagree, have students explain their reasoning until they reach an agreement.
Ask students to share their responses to the second question. Because the thermometer is labeled in 5 degree increments, we have to estimate the temperature between \(0^\circ\) and \(-5^\circ\). Ask students to explain their reasoning and record and display possible responses for all to see. Highlight student responses that include the following ideas:
- The location of negative numbers below 0.
- The distance between numbers on the vertical number line.
1.2: Fractions of a Degree (5 minutes)
Activity
In this activity, students return to the context of a thermometer to examine rational numbers that are not integers. Students compare and interpret the signed numbers to make sense of them in the context (MP2), including comparing a temperature that is not pictured to the temperatures that are pictured.
Launch
Remind students of the warm-up problem about a weather thermometer. Instruct them to estimate when necessary.
Design Principle(s): Maximize meta-awareness; Support sense-making<
Student Facing
-
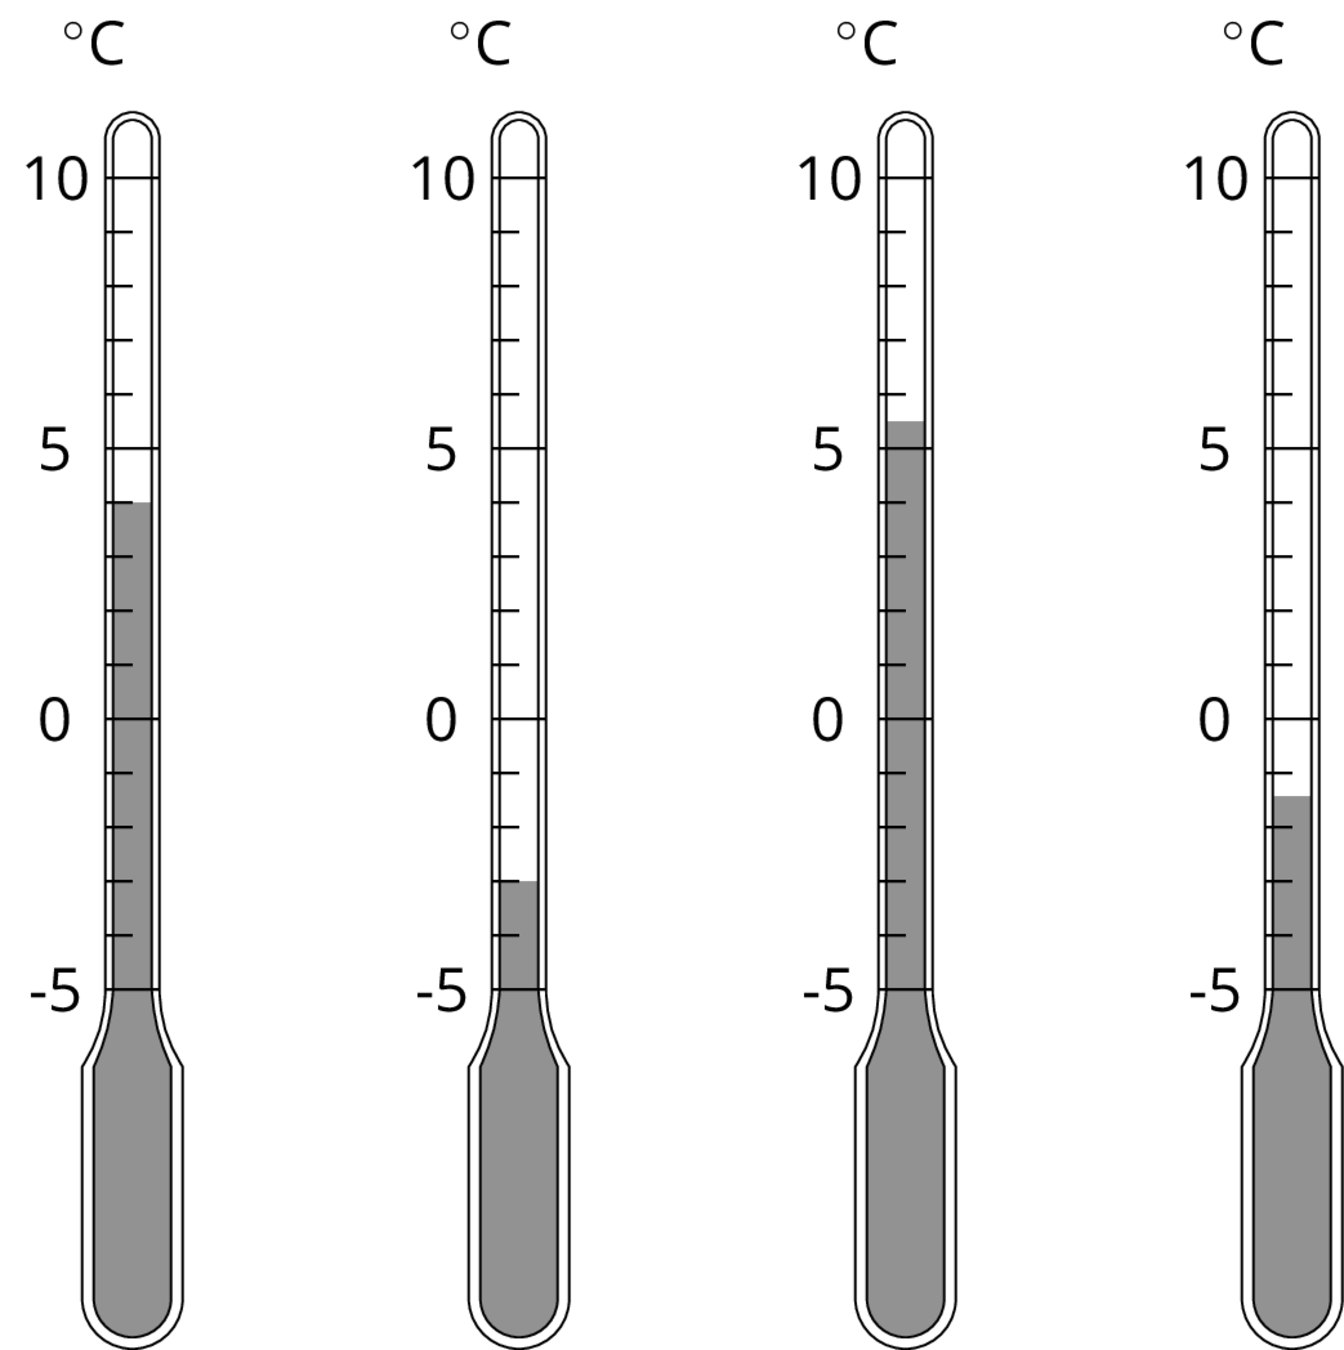
What temperature is shown on each thermometer?
- Which thermometer shows the highest temperature?
- Which thermometer shows the lowest temperature?
-
Suppose the temperature outside is \(\text{-}4^\circ \text{C}\). Is that colder or warmer than the coldest temperature shown? How do you know?
Student Response
For access, consult one of our IM Certified Partners.
Anticipated Misconceptions
Some students may struggle to estimate the temperature on the last thermometer, since it is between two markings. Ask them to tell what the temperature would be for the lines directly above and directly below the thermometer's level. Then ask what temperature would be halfway in between those two numbers.
Some students may struggle with comparing \(\text-4^\circ \text{C}\) to the temperatures shown on the thermometers. Prompt students to point out where \(\text-4^\circ \text{C}\) would be on the thermometer that is showing \(\text-3^\circ \text{C}\).
Activity Synthesis
Ask one or more students to share their response for the temperature for each thermometer.
When discussing the last question, first have students explain their reasoning until they come to an agreement that \(\text-4^\circ\text{C}\) is colder than \(\text-3^\circ\text{C}\). Then, if not brought up in students’ explanations, introduce the notation \(\text-4 < \text-3\) and remind students that this is read, "Negative 4 is less than negative 3." Explain that -4 is farther away from zero than -3 is, and point to the location of -4 on a thermometer to show that is it below -3. On the negative side of the number line, that means -4 is less than -3. Familiarity with less than notation will be useful for describing their reasoning in the next activity.
1.3: Seagulls Soar, Sharks Swim (10 minutes)
Activity
The purpose of this activity is for students to continue interpreting signed numbers in context and to begin to compare their relative location. A vertical number line shows the heights above sea level or depths below sea level of various animals. The number line is labeled in 5 meter increments, so students have to interpolate the height or depth for some of the animals. Next, they are given the height or depth of other animals that are not pictured and asked to compare these to the animals shown.
As students work, monitor for whether they are expressing relative distances in words, for example “3 meters below,” or if they are expressing the same idea with notation, as in -3 meters. Both are acceptable; these ideas are connected in the discussion that follows (MP2). Also monitor for students who notice that there are two possible answers for the last question.
Launch
Display the image for all to see. Tell students to measure the height or depth of each animal's eyes, to the nearest meter. Remind students that we choose sea level to be our zero level, in the same way that we chose a zero level for temperature.
Supports accessibility for: Visual-spatial processing; Conceptual processing
Design Principle(s): Maximize meta-awareness
Student Facing
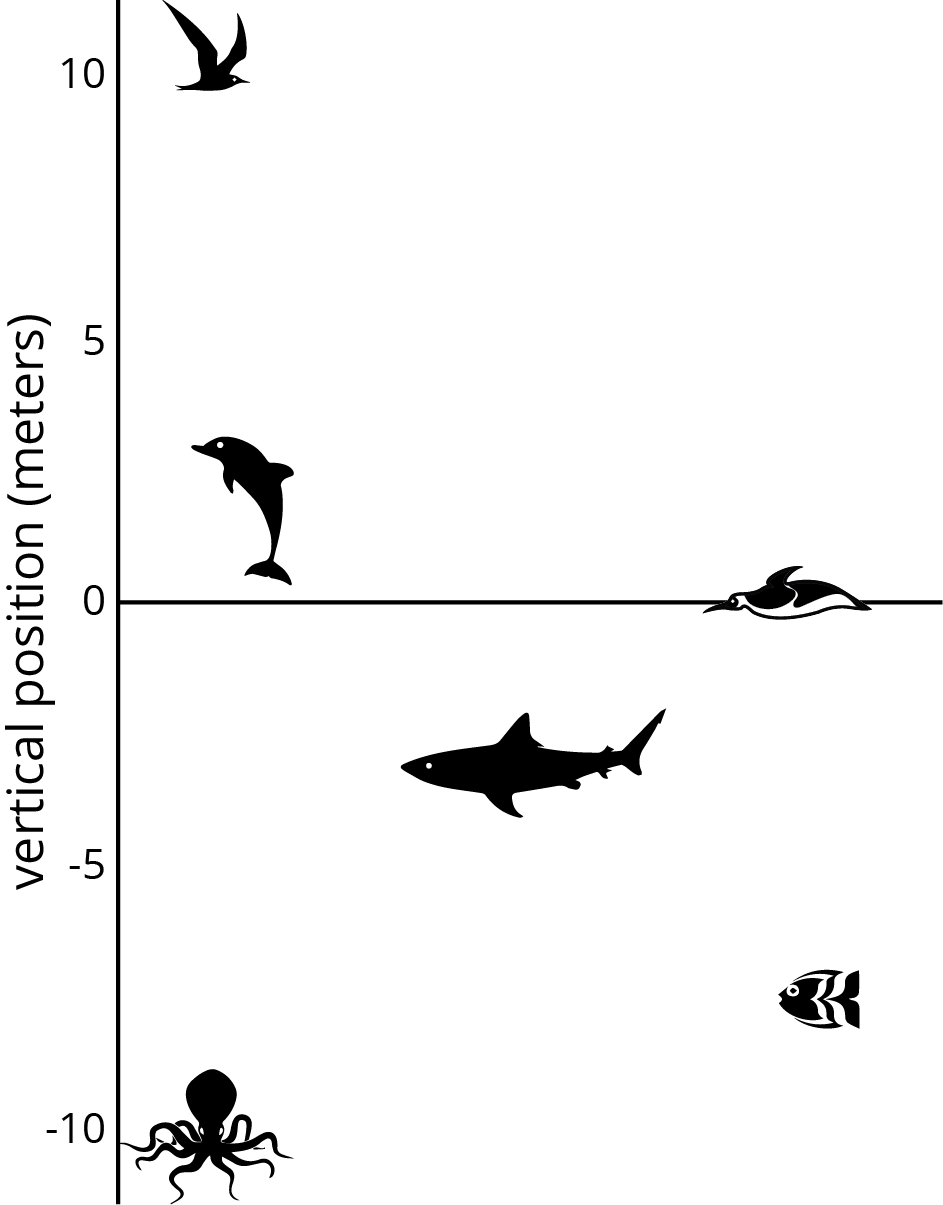
Here is a picture of some sea animals. The number line on the left shows the vertical position of each animal above or below sea level, in meters.
-
How far above or below sea level is each animal? Measure to their eye level.
-
A mobula ray is 3 meters above the surface of the ocean. How does its vertical position compare to the height or depth of:
The jumping dolphin?
The flying seagull?
The octopus?
-
An albatross is 5 meters above the surface of the ocean. How does its vertical position compare to the height or depth of:
The jumping dolphin?
The flying seagull?
The octopus?
-
A clownfish is 2 meters below the surface of the ocean. How does its vertical position compare to the height or depth of:
The jumping dolphin?
The flying seagull?
The octopus?
-
The vertical distance of a new dolphin from the dolphin in the picture is 3 meters. What is its distance from the surface of the ocean?
Student Response
For access, consult one of our IM Certified Partners.
Student Facing
Are you ready for more?
The north pole is in the middle of the ocean. A person at sea level at the north pole would be 3,949 miles from the center of Earth. The sea floor below the north pole is at an elevation of approximately -2.7 miles. The elevation of the south pole is about 1.7 miles. How far is a person standing on the south pole from a submarine at the sea floor below the north pole?
Student Response
For access, consult one of our IM Certified Partners.
Anticipated Misconceptions
If students measure to the top or bottom of the animal, remind them that we are using the eyes of the animal to measure their height or depth.
Some students may struggle to visualize where the albatross, seagull, and clownfish are on the graph. Consider having them draw or place a marker where the new animal is located while comparing it to the other animals in the picture.
Activity Synthesis
The main point for students to get out of this activity is that we can represent distance above and below sea level using signed numbers. The depths of the shark, fish, and octopus can be expressed as approximately -3 m, -6 m, and -7.5 m respectively, because they are below sea level.
Signed numbers can also be used to represent the relative vertical position of different pairs of animals. Have selected students share their responses and reasoning for how the heights of the albatross, seabird, and clownfish compare to the dolphin, seagull, and octopus. Record and display their verbal descriptions using signed numbers. For example, if a student says the albatross is 7 meters below the seagull, write "-7".
Finally, ask whether students noticed the ambiguity in the last question (about the height of the new dolphin). Ask such a student to explain why there are two possible answers to the last question.
1.4: Card Sort: Rational Numbers (15 minutes)
Optional activity
This activity reviews ordering integers first, and then rational numbers second. Many of the numbers also have their additive inverse in the set, which can help students use the structure of the number line to order the numbers.
The previous activities in this lesson used vertical number lines to help students make sense of negative numbers being below 0. It is important that students also feel comfortable working with horizontal number lines. As students work on ordering these slips, it is likely they will automatically make the transition to using a horizontal orientation. Watch for any groups that continue to use a vertical orientation and prompt them to consider whether they have really ordered their numbers from least to greatest.
Monitor for students who specifically compare the magnitudes of numbers and translate that into the correct number order (such as \(2.5 > 2\) so \(\text-2.5 < \text-2\)) are using the structure of the number line (MP7); ask them to share their reasoning in the whole-class discussion.
Launch
Arrange students in groups of 3. Distribute the first set of cards (integers) to each group. Instruct the students to put the cards in order from least to greatest. When a group has finished ordering the first set, give them the second set (rational numbers that are not integers) and have them add these in the correct locations.
Design Principle(s): Support sense-making; Cultivate conversation
Student Facing
- Your teacher will give your group a set of cards. Order the cards from least to greatest.
- Pause here so your teacher can review your work. Then, your teacher will give you a second set of cards.
- Add the new set of cards to the first set so that all of the cards are ordered from least to greatest.
Student Response
For access, consult one of our IM Certified Partners.
Anticipated Misconceptions
Some students may struggle with ordering the negative numbers. For example, they may put -2.5 to the right of -2 since they are used to seeing 2.5 to the right of 2. Help students visualize a number line and figure out which number should be farther away from 0.
Activity Synthesis
Select students to share their strategies when sorting. Highlight strategies that used the magnitudes of a number and its additive inverse.
Discuss:
- Which numbers were the hardest to order? Why?
- How did you decide where to put the fractions?
- How is, for example, \(\text-\frac98\) related to \(\frac98\)?
Introduce the convention that number lines are usually drawn horizontally, with the negative numbers to the left of 0. If any groups put their slips in order vertically, considering having them reposition their slips to match the orientation of a horizontal number line. Make sure students understand the meaning of the term “opposite” and absolute value notation.
Lesson Synthesis
Lesson Synthesis
Main learning points:
- Negative numbers can be used to represent quantities below a chosen zero point.
- Negative numbers can be ordered to the left side of zero on a horizontal number line.
- Absolute value, or magnitude, describes how far away from zero a value is.
Discussion questions:
- Which number is greater, -7 or -12?
- Which number has the greater magnitude, 7 or -12?
- How can we order negative numbers?
1.5: Cool-down - Signed Numbers (5 minutes)
Cool-Down
For access, consult one of our IM Certified Partners.
Student Lesson Summary
Student Facing
We can use positive numbers and negative numbers to represent temperature and elevation.
When numbers represent temperatures, positive numbers indicate temperatures that are warmer than zero and negative numbers indicate temperatures that are colder than zero. This thermometer shows a temperature of -1 degree Celsius, which we write \(\text{-}1^\circ \text{C}\).

When numbers represent elevations, positive numbers indicate positions above sea level and negative numbers indicate positions below sea level.
We can see the order of signed numbers on a number line.

A number is always less than numbers to its right. So \(\text{-}7 < \text{-}3\).
We use absolute value to describe how far a number is from 0. The numbers 15 and -15 are both 15 units from 0, so \(|15| = 15\) and \(| \text{-}15| = 15\). We call 15 and -15 opposites. They are on opposite sides of 0 on the number line, but the same distance from 0.