Lesson 2
Graphs of Proportional Relationships
Let's think about scale.
Problem 1
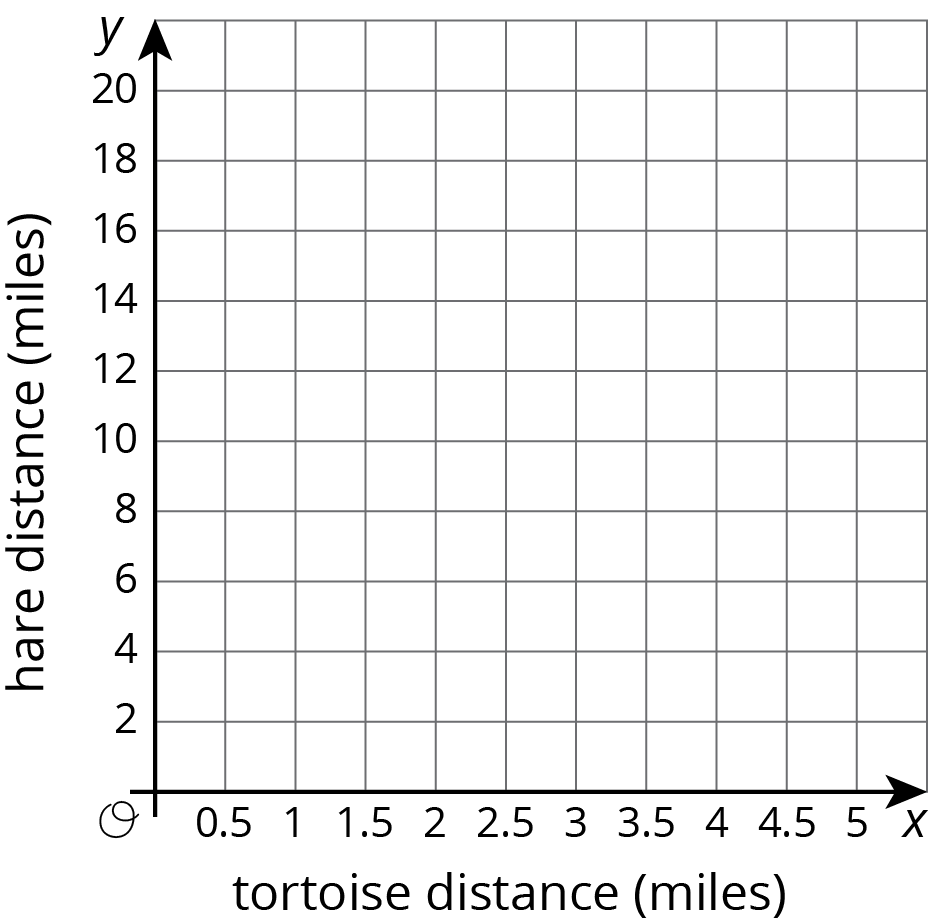
The tortoise and the hare are having a race. After the hare runs 16 miles the tortoise has only run 4 miles.
The relationship between the distance \(x\) the tortoise “runs” in miles for every \(y\) miles the hare runs is \(y=4x\). Graph this relationship.
Problem 2
The table shows a proportional relationship between the weight on a spring scale and the distance the spring has stretched.
- Complete the table.
- Describe the scales you could use on the \(x\) and \(y\) axes of a coordinate grid that would show all the distances and weights in the table.
| distance (cm) | weight (newtons) |
|---|---|
| 20 | 28 |
| 55 | |
| 140 | |
| 1 |
Problem 3
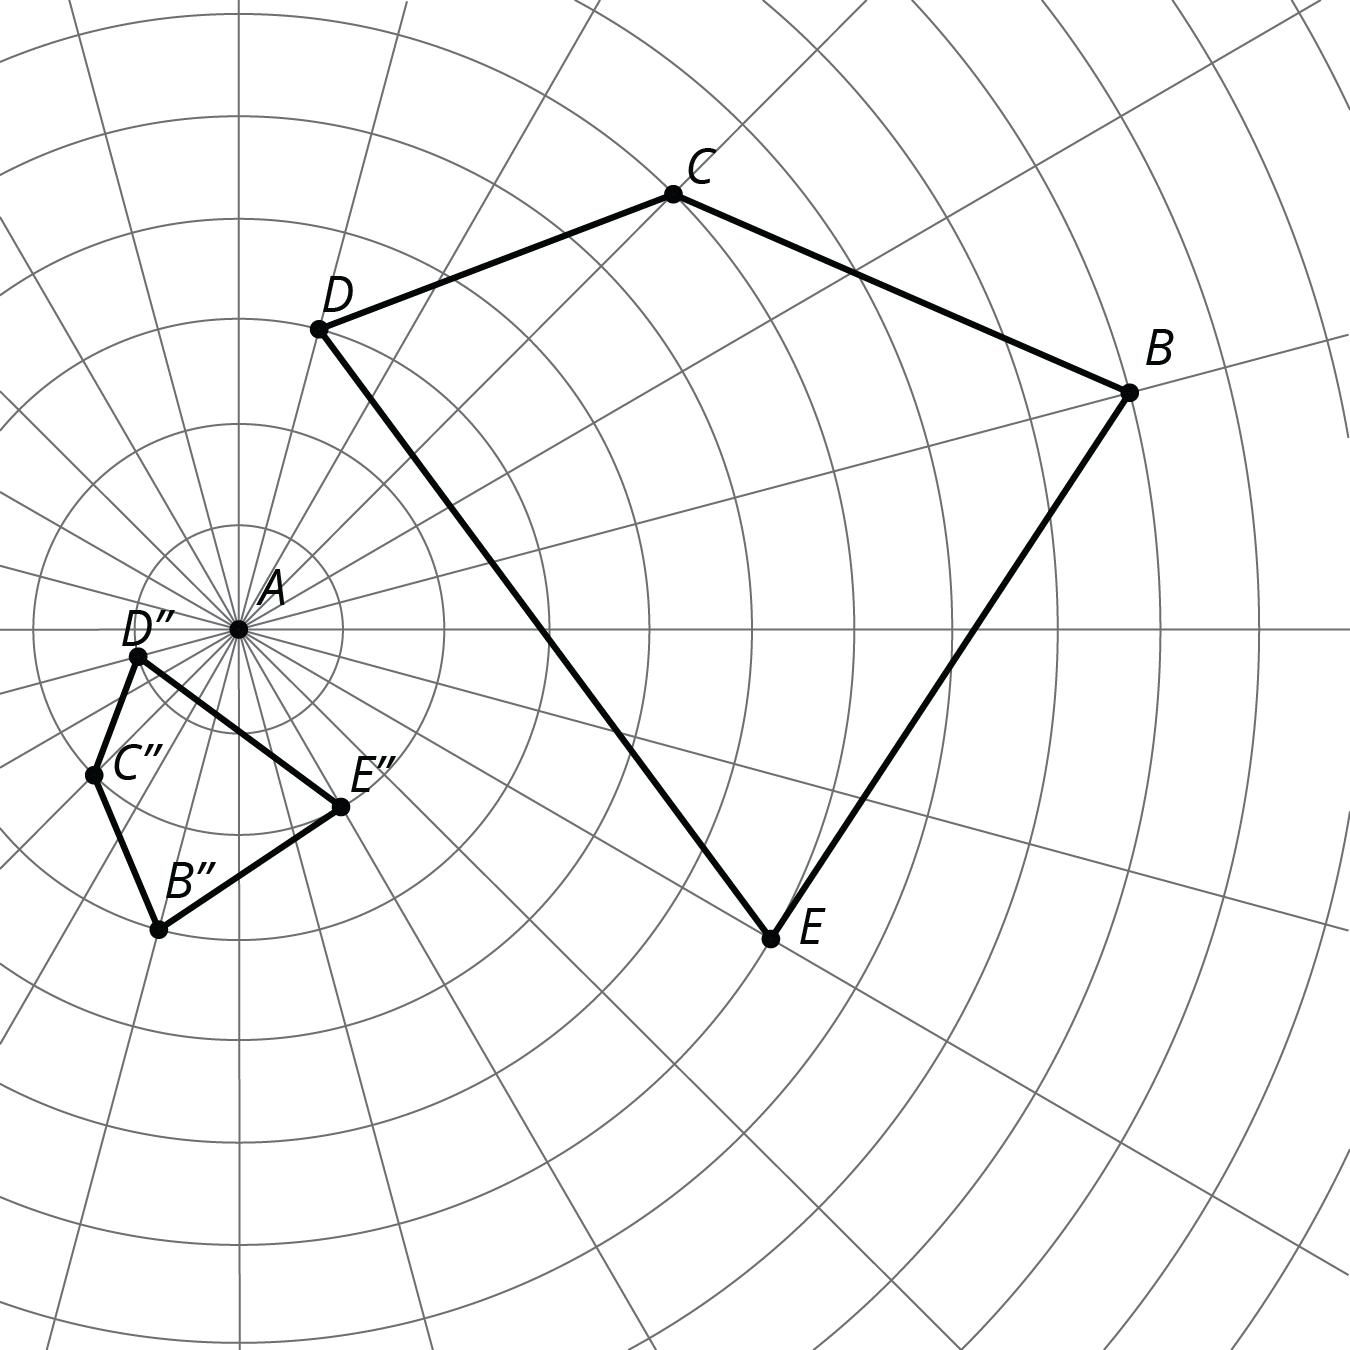
Find a sequence of rotations, reflections, translations, and dilations showing that one figure is similar to the other. Be specific: give the amount and direction of a translation, a line of reflection, the center and angle of a rotation, and the center and scale factor of a dilation.
Problem 4
Andre said, “I found two figures that are congruent, so they can’t be similar.”
Diego said, “No, they are similar! The scale factor is 1.”
Do you agree with either of them? Use the definition of similarity to explain your answer.