Lesson 11
Interpreting Graphs of Proportional Relationships
Let’s read stories from the graphs of proportional relationships.
Problem 1
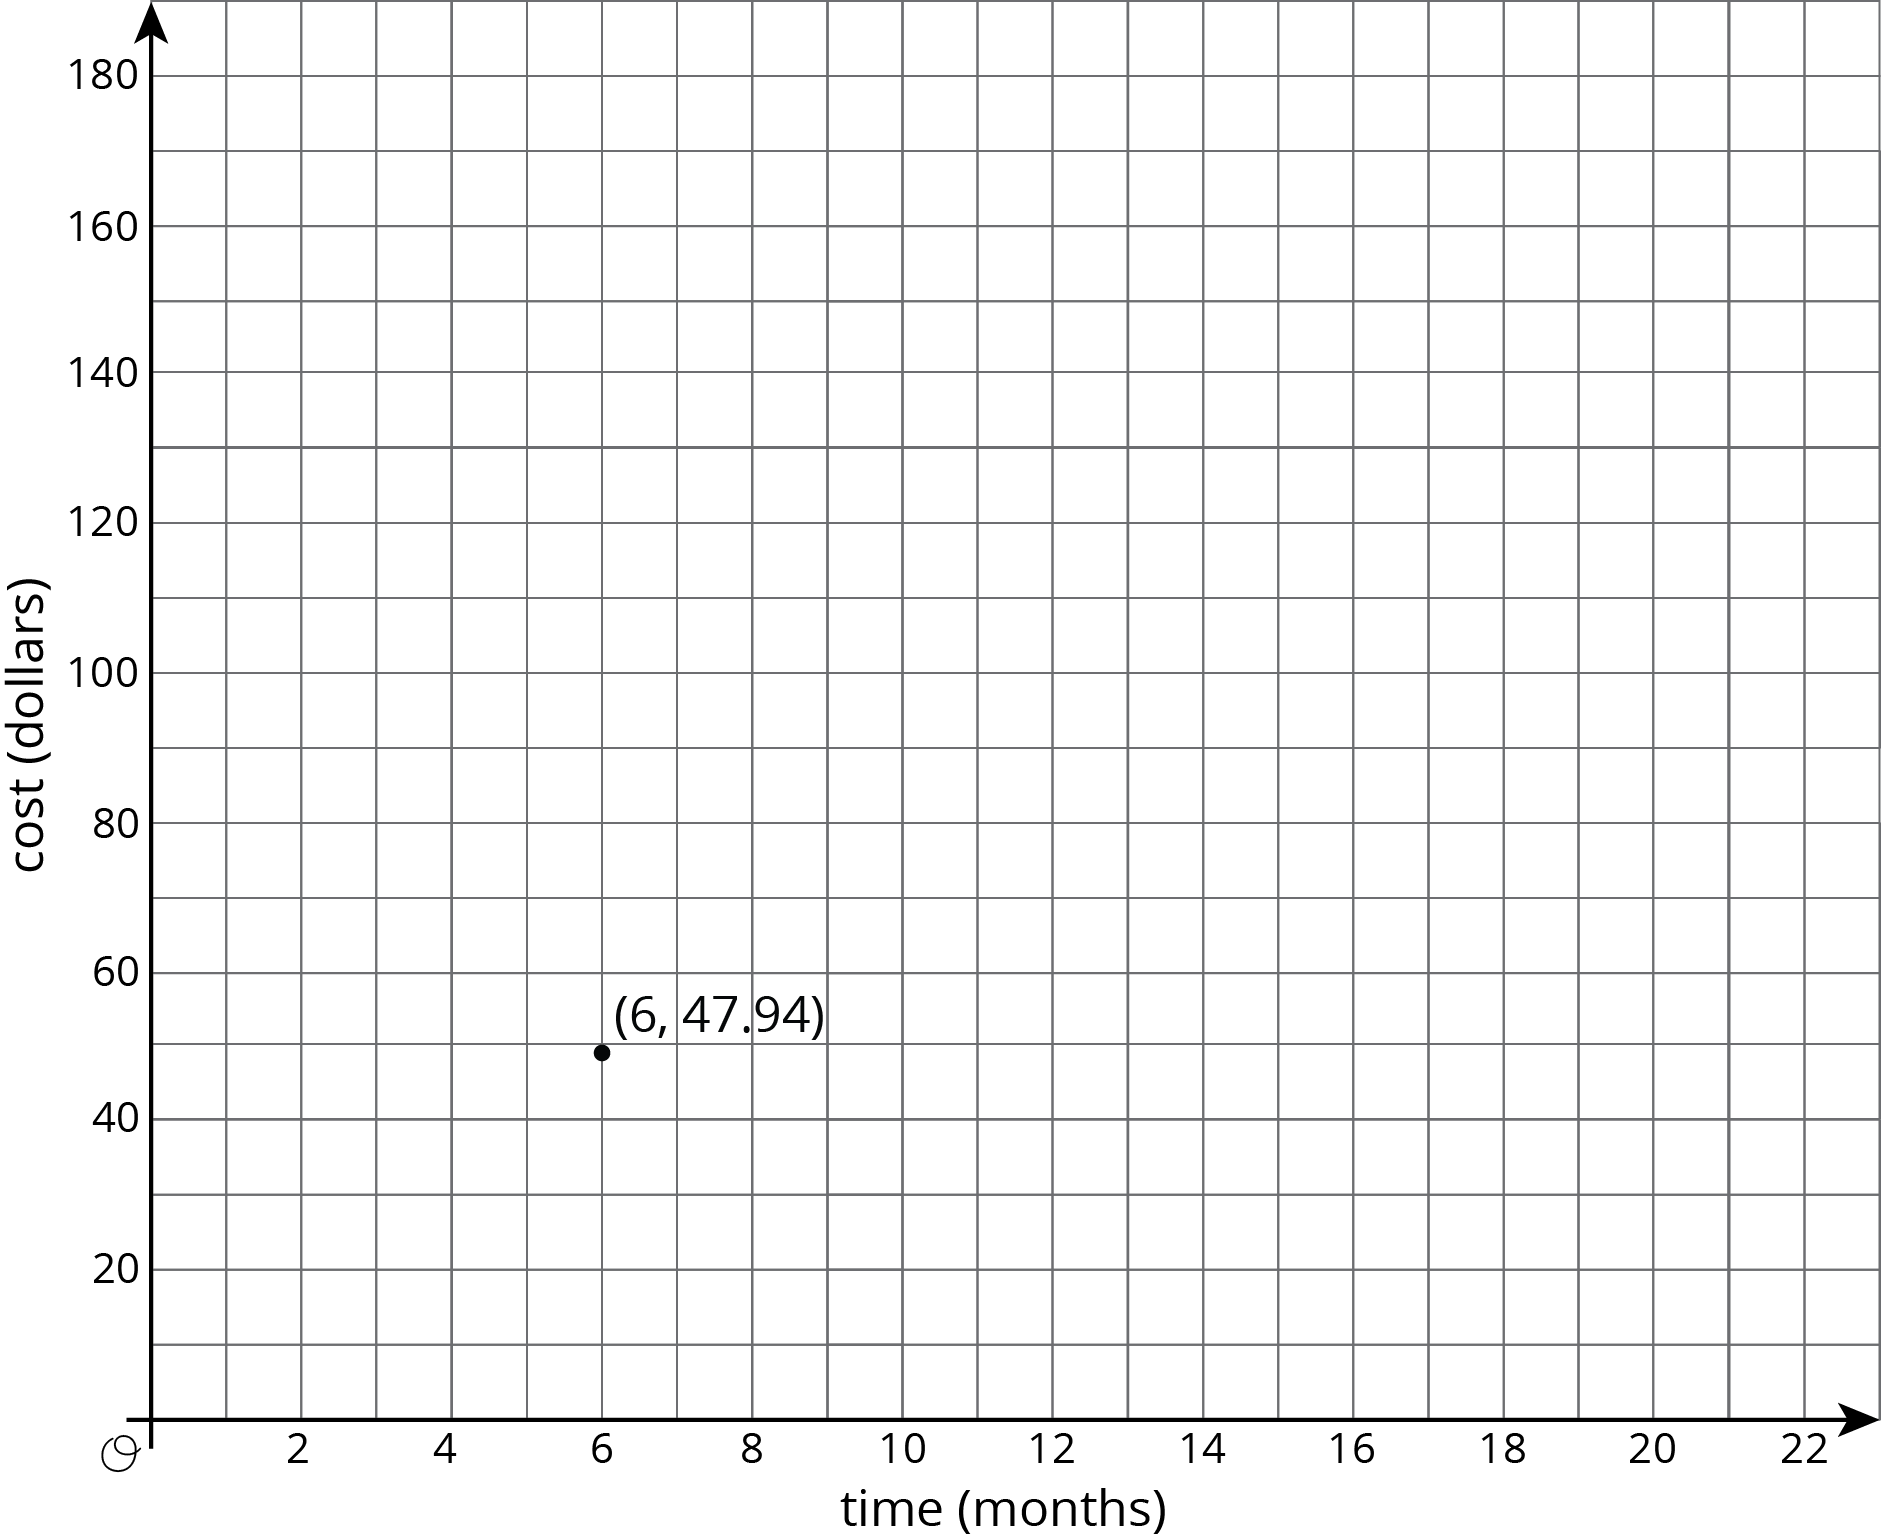
There is a proportional relationship between the number of months a person has had a streaming movie subscription and the total amount of money they have paid for the subscription. The cost for 6 months is $47.94. The point \((6, 47.94)\) is shown on the graph below.

- What is the constant of proportionality in this relationship?
- What does the constant of proportionality tell us about the situation?
- Add at least three more points to the graph and label them with their coordinates.
- Write an equation that represents the relationship between \(C\), the total cost of the subscription, and \(m\), the number of months.
Problem 2
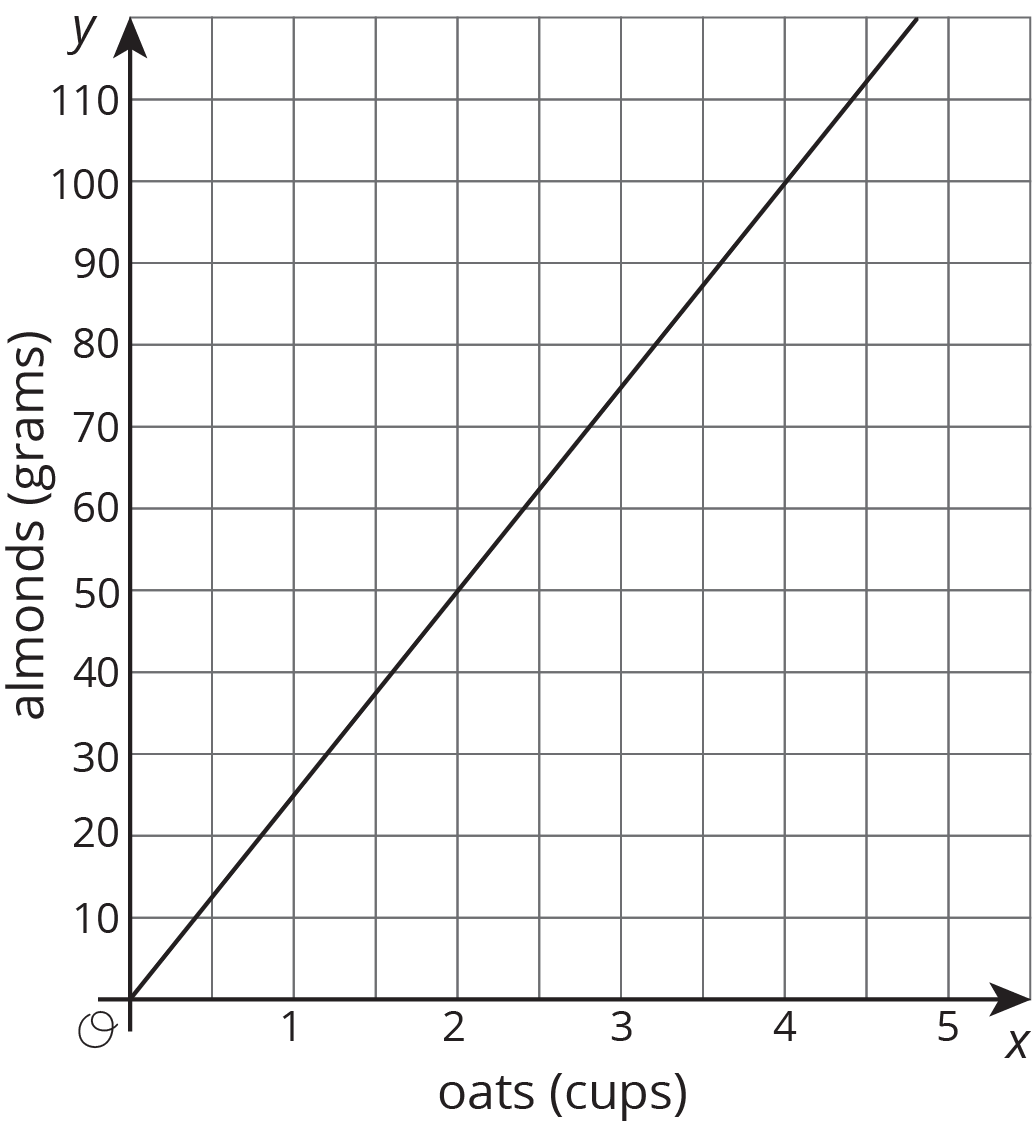
The graph shows the amounts of almonds, in grams, for different amounts of oats, in cups, in a granola mix. Label the point \((1, k)\) on the graph, find the value of \(k\), and explain its meaning.

Problem 3
To make a friendship bracelet, some long strings are lined up then taking one string and tying it in a knot with each of the other strings to create a row of knots. A new string is chosen and knotted with the all the other strings to create a second row. This process is repeated until there are enough rows to make a bracelet to fit around your friend's wrist.
Are the number of knots proportional to the number of rows? Explain your reasoning.
Problem 4
What information do you need to know to write an equation relating two quantities that have a proportional relationship?