Lesson 25
Solving Problems with Systems of Linear Inequalities in Two Variables
25.1: Which One Doesn’t Belong: Graphs of Solutions (5 minutes)
Warm-up
This warm-up prompts students to carefully analyze and compare graphs that represent linear equations and inequalities. Making comparisons prompts students to think about the solutions to the equations, inequalities, or systems that are being represented. It also gives students a reason to use language precisely (MP6).
Arrange students in groups of 2–4. Display the graphs for all to see. Give students 1 minute of quiet think time and then time to share their thinking with their small group. In their small groups, ask each student to share their reasoning why a particular item does not belong, and together find at least one reason each item doesn't belong.
Launch
Arrange students in groups of 2–4. Display the graphs for all to see. Ask students to indicate when they have noticed one that does not belong and can explain why. Give students 1 minute of quiet think time and then time to share their thinking with their small group. In their small groups, tell each student to share their reasoning why a particular item does not belong and together find at least one reason each item doesn't belong.
Student Facing
Which one doesn’t belong?
A

B

C

D

Student Response
For access, consult one of our IM Certified Partners.
Activity Synthesis
Ask each group to share one reason why a particular item does not belong. Record and display the responses for all to see. After each response, ask the class if they agree or disagree. Since there is no single correct answer to the question of which one does not belong, attend to students’ explanations and ensure the reasons given are correct.
During the discussion, ask students to explain the meaning of any terminology they use, such as infinitely many solutions or boundary line. Also, press students on unsubstantiated claims.
25.2: Focusing on the Details (10 minutes)
Activity
Previously, students have learned that any point that is in the overlapping solution regions of the graphs of two inequalities is a solution to the system formed by those inequalities. In this activity, students take a closer look at whether points that are on the boundary lines are solutions to the system.
Launch
Arrange students in groups of 2. Display the system of inequalities and the graphs for all to see.
Give students a minute of quiet time to think about which region represents the solutions to each inequality and be prepared to explain how they know. Then, give students another minute to discuss their thinking with a partner. Follow with a class discussion.
Students are likely to identify the inequality that each graph represents by considering the equation of the boundary line. They may relate the solidly shaded region to \(x<y\) because the dashed line is the graph of \(x=y\). Or they may relate the hashed region to the solutions of \(y\geq \text-2x-6\) because the boundary line has a negative slope and it intersects the \(y\)-axis at \((0,\text-6)\).
Other students may test some coordinate pairs in each region and see if they make an inequality true. For example, they may say that all points above the graph of \(x=y\) has an \(x\)-value that is less than the \(y\)-value.
If these strategies for connecting the algebraic and graphical representations are not mentioned by students, bring them up.
Tell students that they will now think about whether certain points on the coordinate plane are solutions to the system.
Supports accessibility for: Language; Memory
Student Facing
Here are the graphs of the inequalities in this system:
\(\displaystyle \begin{cases} x< y\\ y\geq \text-2x-6 \end{cases}\)

Decide whether each point is a solution to the system. Be prepared to explain how you know.
- \((3, \text-5)\)
- \((0,5)\)
- \((\text-6,6)\)
- \((3,3)\)
- \((\text-2,\text-2)\)
Student Response
For access, consult one of our IM Certified Partners.
Student Facing
Are you ready for more?
Find a system of inequalities with this triangle as its set of solutions.

Student Response
For access, consult one of our IM Certified Partners.
Activity Synthesis
Focus the discussion on the points on the boundary lines and how students determined if they are or are not solutions to the system.
Highlight explanations that state that a solution to a system of linear inequalities must be a solution to every inequality in the system. If a point on the boundary line is not included in the solution set of one inequality (so the graph is a dashed line), then it is also not included in the solution set of the system.
Design Principle(s): Support sense-making
25.3: Info Gap: Terms of A Team (20 minutes)
Activity
This info gap activity gives students an opportunity to use their understandings of systems of linear inequalities to solve problems that involve satisfying multiple constraints simultaneously.
The info gap structure requires students to make sense of problems and persevere in solving them (MP1). Students need determine what information is necessary to solve a problem, ask for the information, and then explain their request. This may take several rounds of discussion if their first requests do not yield the information they need. It also allows them to refine the language they use and ask increasingly more precise questions until they get the information they need (MP6).
Students may approach the problems in different ways, including by guessing and checking, but the problems can be efficiently solved by writing and solving systems of linear inequalities.
Every clue given in a data card can be written as an inequality. If \(x\) is the number of children on a team and \(y\) the number of adults, the clue "a team with only adults is not allowed" can be expressed as \(x>0\), and "a team without adults is allowed" can be expressed as \(y\ge0\). But because other membership rules are more restrictive, and because thinking only about positive values of \(x\) and \(y\) is natural in this situation, it is not essential for these constraints to be represented. (The blank coordinate planes provided also show only the first quadrant, implying positive solutions.)
In an upcoming lesson, students will look more closely at the inequalities \(x>0\) and \(y>0\).
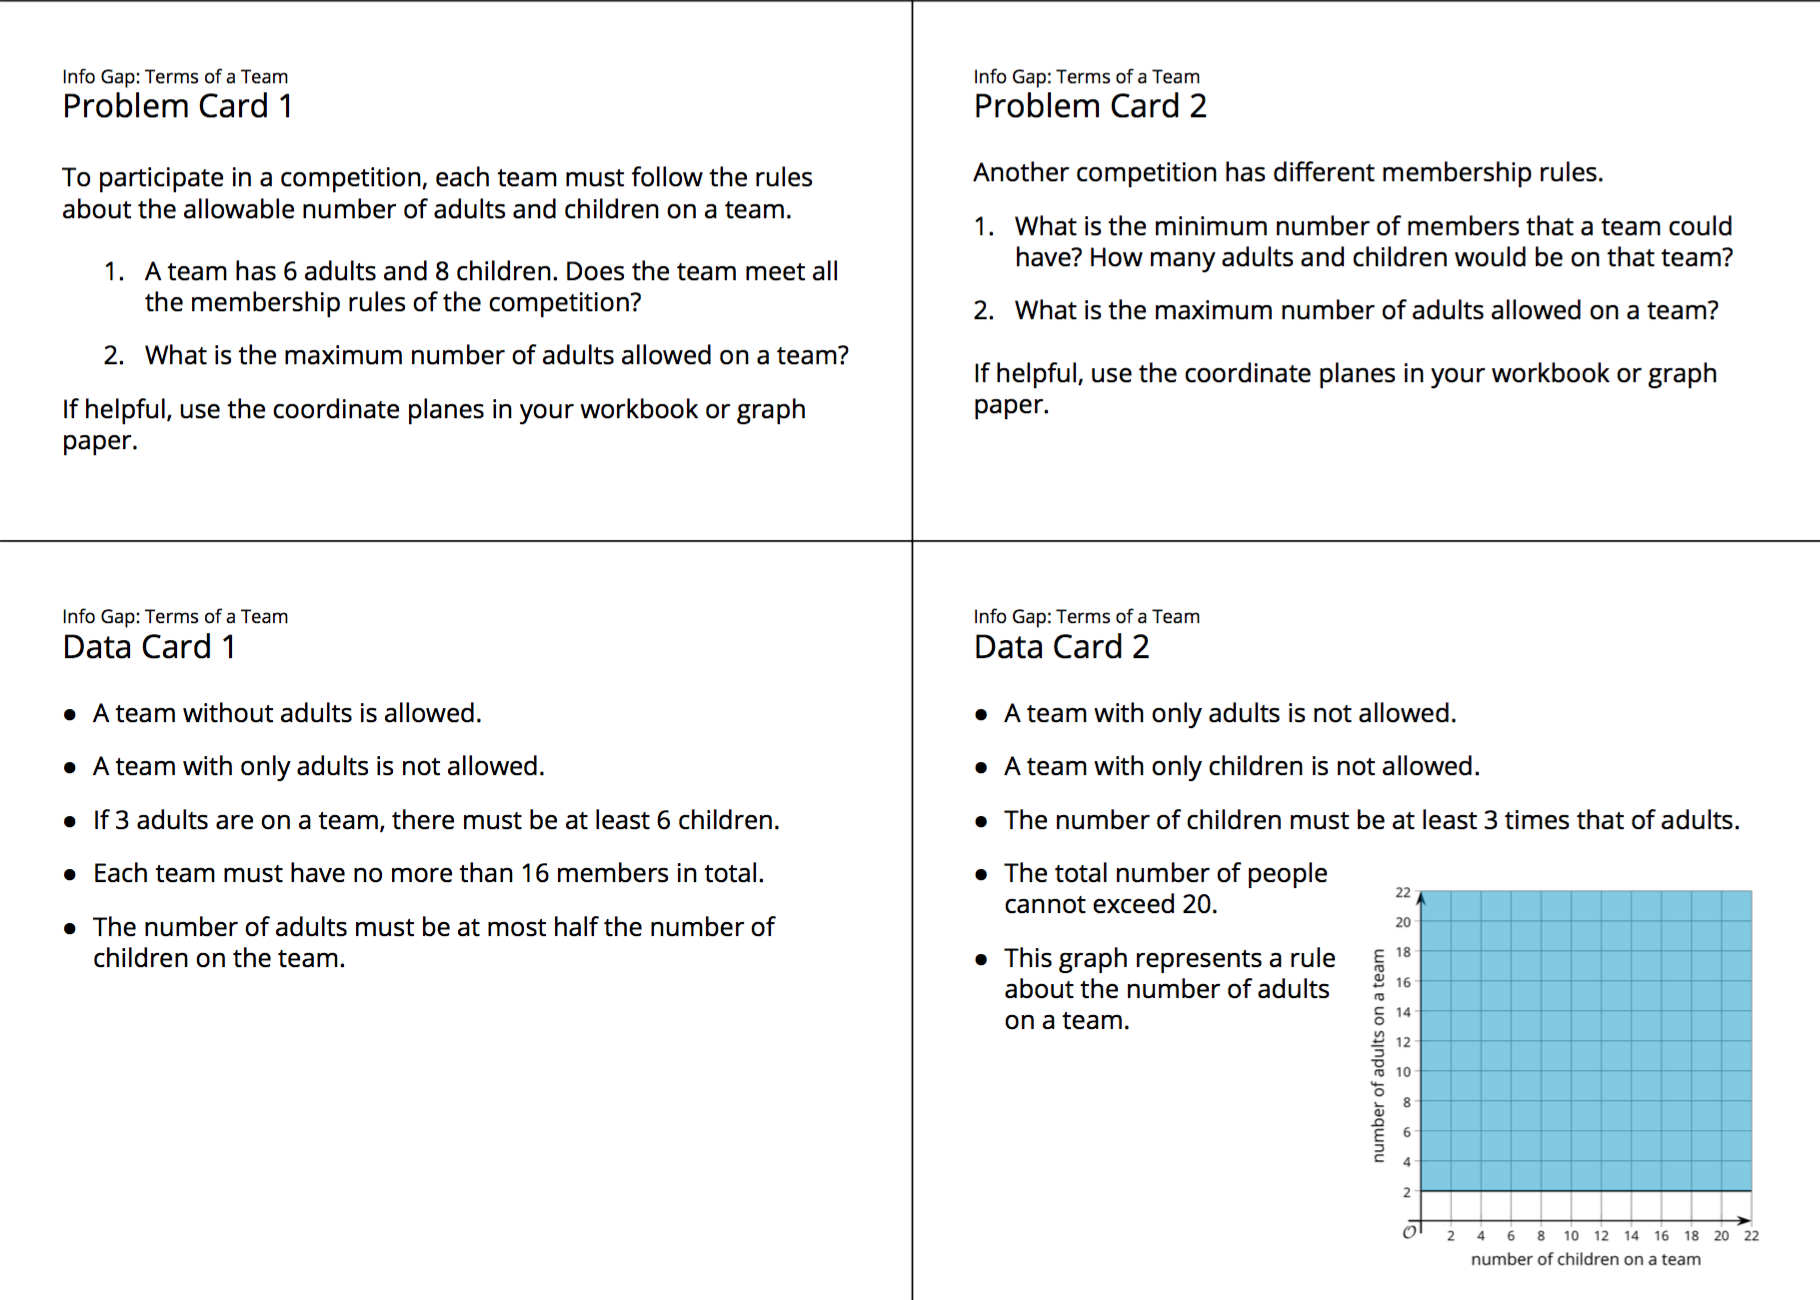
Here is the text of the cards for reference and planning:
Launch
Explain the info gap structure, and consider demonstrating the protocol if students are unfamiliar with it.
Arrange students in groups of 2. In each group, distribute a problem card to one student and a data card to the other student. After reviewing their work on the first problem, give them the cards for a second problem and instruct them to switch roles.
Because this activity was designed to be completed without technology, ask students to put away any devices.
Design Principle(s): Cultivate Conversation
Supports accessibility for: Memory; Organization
Student Facing
Your teacher will give you either a problem card or a data card. Do not show or read your card to your partner.
If your teacher gives you the data card:
- Silently read the information on your card.
- Ask your partner “What specific information do you need?” and wait for your partner to ask for information. Only give information that is on your card. (Do not figure out anything for your partner!)
- Before telling your partner the information, ask “Why do you need to know (that piece of information)?”
- Read the problem card, and solve the problem independently.
- Share the data card, and discuss your reasoning.
If your teacher gives you the problem card:
- Silently read your card and think about what information you need to answer the question.
- Ask your partner for the specific information that you need.
- Explain to your partner how you are using the information to solve the problem.
- When you have enough information, share the problem card with your partner, and solve the problem independently.
- Read the data card, and discuss your reasoning.
Pause here so your teacher can review your work. Ask your teacher for a new set of cards and repeat the activity, trading roles with your partner.
The blank coordinate planes are provided here in case they are useful.

Student Response
For access, consult one of our IM Certified Partners.
Anticipated Misconceptions
Students in both roles may wonder if all clues on the data card constitute a “rule.” Those holding a data card may not know how to respond if or when asked, “What is the first rule?” or "What is one of the rules?" Those who are asking for information may not know if what is given counts as a rule. Clarify that a rule should be general enough to include multiple possibilities, rather than just one specific case. For example, "If there are 3 adults, there must be at least 6 children" is a specific case, rather than a general constraint.
Activity Synthesis
Invite students who solved the problems by graphing a system of inequalities to share their graphs and their thinking, or display the following graphs.
Discuss questions such as:
- "Which membership rule does each shaded region on the graphs represent?"
- "Can all the clues be written as an inequality? If so, what are they?"
- "Should we graph them all? Why or why not?"
- "How does the first set of graphs help us answer questions about whether 6 adults and 8 children are acceptable?"
- "How do they tell us about the maximum allowable number of adults on a team?"
- "How does the second set of graphs help us find the minimum number of team members and the composition of the team?"
Situation 1:

Situation 2:

Lesson Synthesis
Lesson Synthesis
Refer to the constraints in the "Terms of a Team" info gap activity. Keep the graphs of the solution regions displayed for all to see.
Situation 1:
Situation 2:
To reiterate the importance of attending carefully to the boundary lines of the regions, ask questions such as:
- "In the graphs of the first system, are points on the two lines—say \((14,2)\) or \((8,4)\)—solutions to the system? How do you know?" (Yes. Points on a solid line are included. Substituting 14 and 2, or 8 and 4, makes each inequality true.)
- "In this situation, are points on the horizontal axis solutions to the system?" (Yes. Points on the horizontal axis represent no adults. The rules say that a team with only children and no adults is allowed.)
- "In the graphs of the second system, are points on the boundaries of the overlapping triangular region solutions to the system?" (Yes)
25.4: Cool-down - Widgets and Zurls (5 minutes)
Cool-Down
For access, consult one of our IM Certified Partners.
Student Lesson Summary
Student Facing
A family has at most \$25 to spend on activities at Fun Zone. It costs \$10 an hour to use the trampolines and \$5 an hour to use the pool. The family can stay less than 4 hours.
What are some combinations of trampoline time and pool time that the family could choose given their constraints?
We could find some combinations by trial and error, but writing a system of inequalities and graphing the solution would allow us to see all the possible combinations.
Let \(t\) represent the time, in hours, on the trampolines and \(p\) represent the time, in hours, in the pool.
The constraints can be represented with the system of inequalities:
\(\begin{cases} \begin{align}10t+5p & \leq 25\\t +\hspace{2.1mm}p&<4 \end{align} \end{cases}\)
Here are graphs of the inequalities in the system.
The solution set to the system is represented by the region where shaded parts of the two graphs overlap. Any point in that region is a pair of times that meet both the time and budget constraints.
The graphs give us a complete picture of the possible solutions.

-
Can the family spend 1 hour on the trampolines and 3 hours in the pool?
No. We can reason that it is because those times add up to 4 hours, and the family wants to spend less than 4 hours. But we can also see that the point \((1,3)\) lies on the dashed line of one graph, so it is not a solution.
-
Can the family spend 2 hours on the trampolines and 1.5 hours in the pool?
No. We know that these two times add up to less than 4 hours, but to find out the cost, we need to calculate \(10(2)+5(1.5)\), which is 27.5 and is more than the budget.
It may be easier to know that this combination is not an option by noticing that the point \((2,1.5)\) is in the region with line shading, but not in the region with solid shading. This means it meets one constraint but not the other.