Lesson 23
Solving Problems with Inequalities in Two Variables
23.1: Graphing Inequalities with Technology (10 minutes)
Warm-up
In this warm-up, students use graphing technology to graph simple linear inequalities in two variables. They practice adjusting the graphing window until the solution regions become visible and give useful information. Later in the lesson, students will write inequalities that represent constraints in different situations and find the solution sets. The exercises here prepare students to do the latter using graphing technology.
Launch
Give students access to graphing technology. If using Desmos:
- Explain to students that typing "\(< =\) " gives the \(\le\) symbol and typing "\(> =\)" gives the \(\ge\) symbol.
- Remind students that the \(+\) and \(-\) buttons can be used to zoom in and out of the graphing window, and that the wrench button in the upper right corner can be used to set the graphing window precisely.
If using other graphing technology available in your classroom:
- Demonstrate how to enter the \(\leq\) and \(\geq\) symbols.
- Remind students how to set a useful graphing window by zooming in or out, and how to set a precise graphing window by specifying the horizontal and vertical boundaries.
- (For technology that takes only equations or inequalities in slope-intercept form:) Remind students that some inequalities might need to be rewritten such that \(y\) is isolated before the inequality can be entered into the graphing tool.
Student Facing
Use graphing technology to graph the solution region of each inequality and sketch each graph. Adjust the graphing window as needed to show meaningful information.
\(y > x\)

\(y \geq x\)

\(y<\text-8\)

\(\text-x + 8 \leq y\)

\(y < 10x - 200\)

\(2x + 3y > 60\)

Student Response
For access, consult one of our IM Certified Partners.
Activity Synthesis
Display the correct solution regions for all to see and ask students to check their graphs. Discuss any challenges students may have come across when trying to graph using technology.
Explain to students that they will now use graphing technology to find solutions to some inequalities that represent constraints in situations.
23.2: Solving Problems with Inequalities in Two Variables (25 minutes)
Activity
This activity enables students to integrate several ideas and skills from the past few lessons. Students write inequalities in two variables to represent constraints in situations, use technology to graph the solutions, interpret points in the solution regions, and use the inequalities and the graphs to answer contextual questions. In doing so, they engage in aspects of mathematical modeling (MP4).
The questions in this activity are written in pairs. The same constraints and contexts will be used in an upcoming lesson on systems of linear inequalities in two variables.
Decide on the structure for the activity depending on the time available and the amount of practice each student needs. Here are some possibilities:
- Assigning all three pairs of questions to all students.
- Assigning each student a pair of questions, arranging students who work on different pairs in groups of 3, and asking them to explain their solutions to one another.
- Arranging students in groups of 3, assigning the same pair of questions to each group, and—for each pair of questions—asking one group to present the solutions to the class.
Launch
Continue to provide access to graphing technology. Explain that students will now write and graph inequalities to solve problems about some situations.
Assign at least one pair of questions about the same context to each student. See Activity Narrative for some possible ways to structure the activity.
Some students might not be familiar with terms such as "savings," "checking," or "premium." Explain any unfamiliar terms as needed.
Supports accessibility for: Attention; Social-emotional skills
Student Facing
Here are three situations. There are two questions about each situation. For each question that you work on:
a. Write an inequality to describe the constraints. Specify what each variable represents.
b. Use graphing technology to graph the inequality. Sketch the solution region on the coordinate plane and label the axes.
c. Name one solution to the inequality and explain what it represents in that situation.
d. Answer the question about the situation.
Bank Accounts
-
A customer opens a checking account and a savings account at a bank. They will deposit a maximum of $600, some in the checking account and some in the savings account. (They might not deposit all of it and keep some of the money as cash.)
If the customer deposits $200 in their checking account, what can you say about the amount they deposit in their savings account?
-
The bank requires a minimum balance of $50 in the savings account. It does not matter how much money is kept in the checking account.
If the customer deposits no money in the checking account but is able to maintain both accounts without penalty, what can you say about the amount deposited in the savings account?


Concert Tickets
-
Two kinds of tickets to an outdoor concert were sold: lawn tickets and seat tickets. Fewer than 400 tickets in total were sold.
If you know that exactly 100 lawn tickets were sold, what can you say about the number of seat tickets?
-
Lawn tickets cost \$30 each and seat tickets cost \$50 each. The organizers want to make at least $14,000 from ticket sales.
If you know that exactly 200 seat tickets were sold, what can you say about the number of lawn tickets?


Advertising Packages
-
An advertising agency offers two packages for small businesses who need advertising services. A basic package includes only design services. A premium package includes design and promotion. The agency's goal is to sell at least 60 packages in total.
If the agency sells exactly 45 basic packages, what can you say about the number of premium packages it needs to sell to meet its goal?
-
The basic advertising package has a value of \$1,000 and the premium package has a value of \$2,500. The goal of the agency is to sell more than $60,000 worth of small-business advertising packages.
If you know that exactly 10 premium packages were sold, what can you say about the number of basic packages the agency needs to sell to meet its goal?


Student Response
For access, consult one of our IM Certified Partners.
Student Facing
Are you ready for more?
This activity will require a partner.
- Without letting your partner see it, write an equation of a line so that both the \(x\)-intercept and the \(y\)-intercept are each between -3 and 3. Graph your equation on one of the coordinate systems.
Your Inequality
Your Partner's Inequality
- Still without letting your partner see it, write an inequality for which your equation is the related equation. In other words, your line should be the boundary between solutions and non-solutions. Shade the solutions on your graph.
- Take turns stating coordinates of points. Your partner will tell you whether your guess is a solution to their inequality. After each partner has stated a point, each may guess what the other’s inequality is. If neither guesses correctly, play continues. Use the other coordinate system to keep track of your guesses.
Student Response
For access, consult one of our IM Certified Partners.
Anticipated Misconceptions
One inequality in the bank account context involves only one variable. Some students might think that all inequalities they write must include two variables. Reassure them that this might not always be the case. Consider pointing to examples from earlier activities in which they wrote or graphed inequalities such as \(y>2\) or \(b<10\).
Activity Synthesis
Select one student or one group to present their solutions for each pair of questions. Focus the discussion on how students used the inequalities and graphs to help answer the question about each situation.
Students who worked on the same questions might end up with different graphs and answers because they wrote different inequalities (which might not correctly represent the constraints in the situation). If this happens, analyze the different inequalities and look for the potential causes for the discrepancy. One possibility is that the wrong symbols or the wrong numbers were entered into the graphing tool.
Another possibility might be that students made different decisions about the quantities being assigned to the vertical and horizontal axes. In that case, both versions of the graphs might be correct, but the answers to questions might be different if one of the graphs is not interpreted correctly.
23.3: Card Sort: Representations of Inequalities (15 minutes)
Optional activity
This optional activity allows students to practice interpreting inequalities in context and reasoning about their solutions graphically and numerically. A sorting and matching task gives students opportunities to analyze representations, statements, and structures closely and to make connections (MP2, MP7).
As students explain their thinking to a partner, encourage them to use precise language and mathematical terms to refine their explanations (MP6).
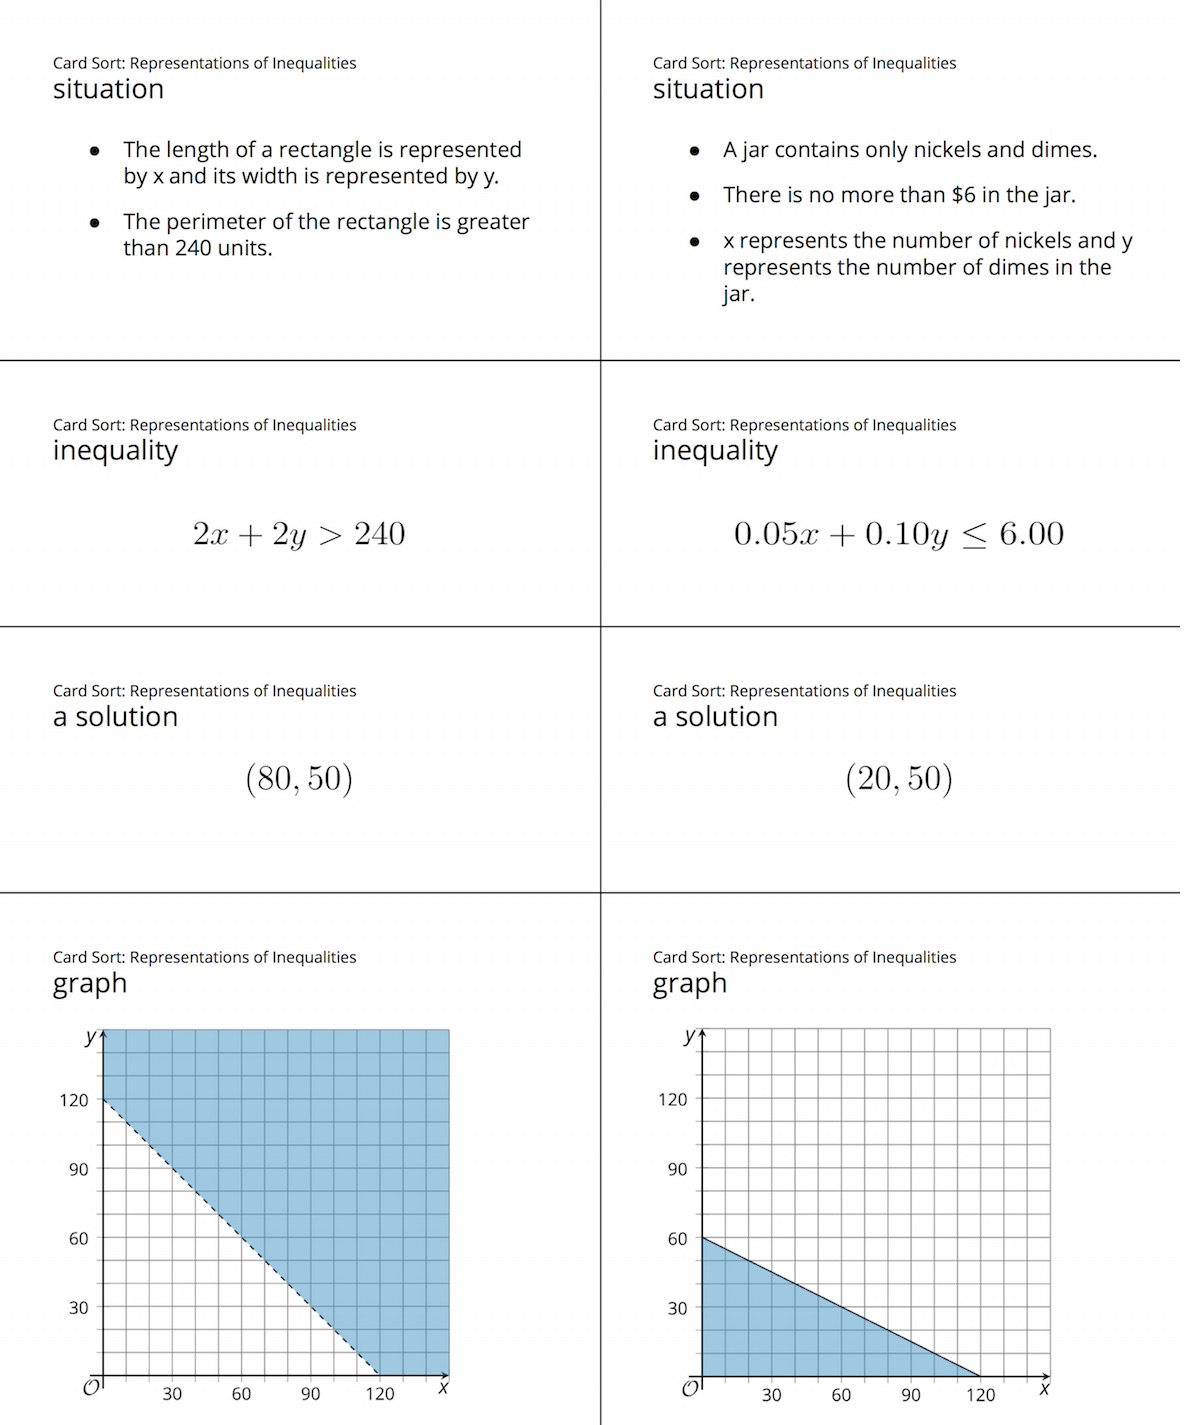
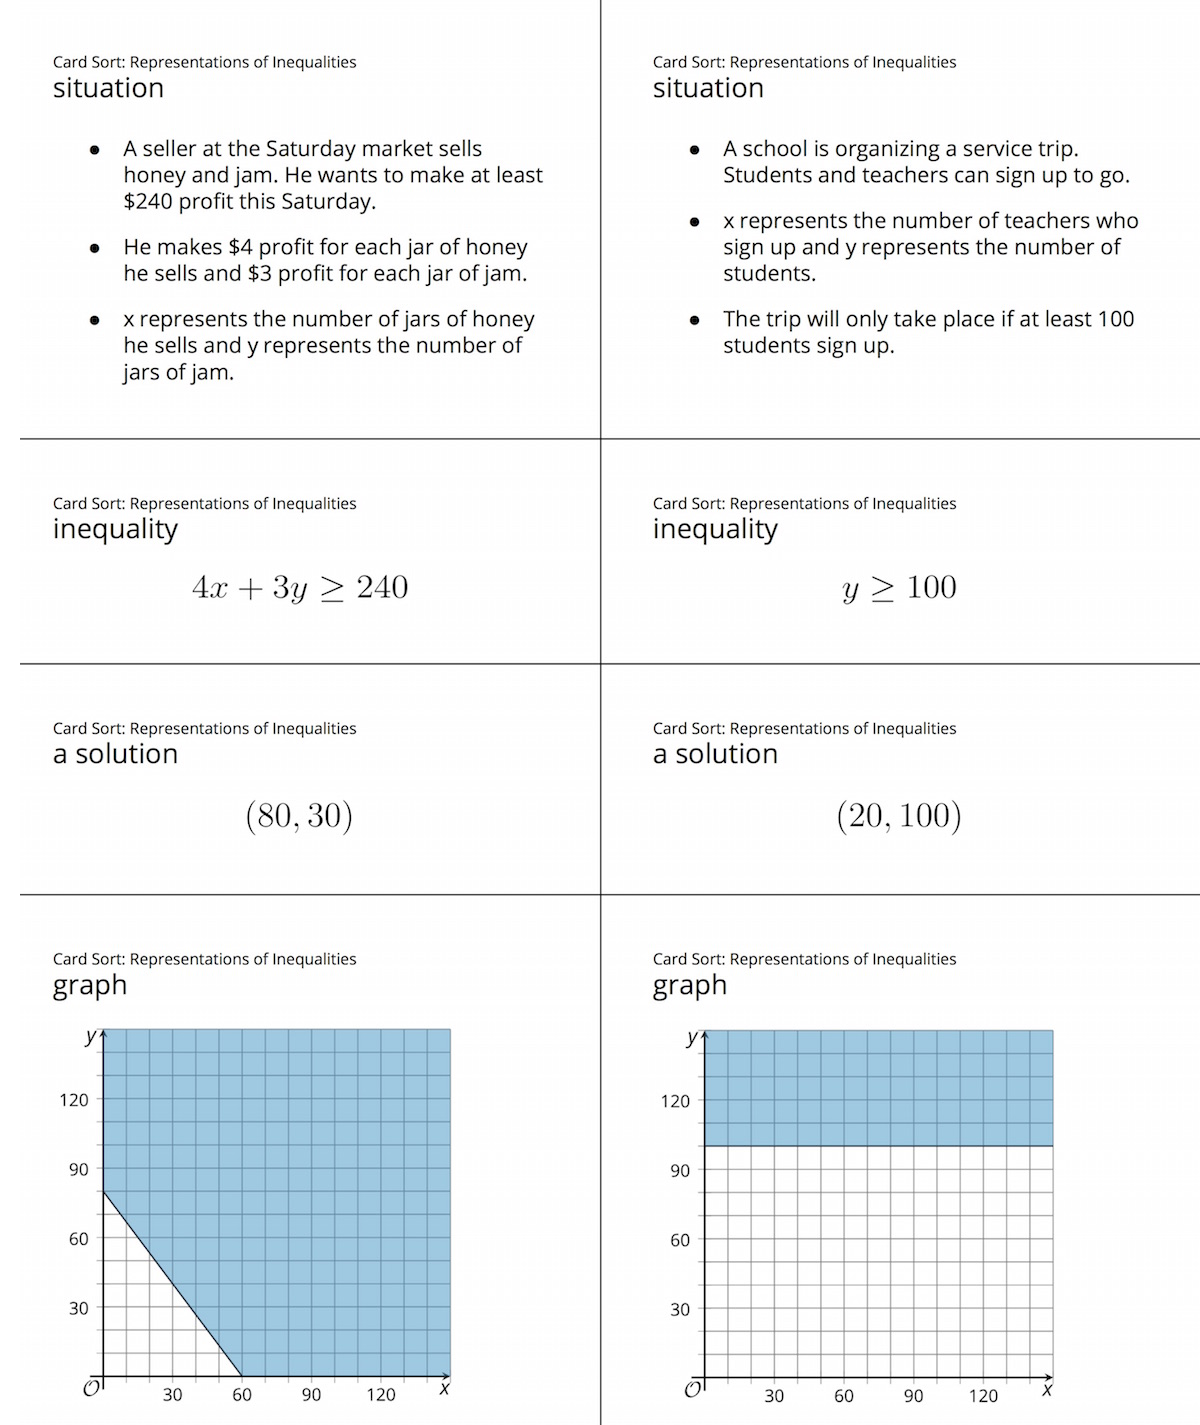
Here are images of the sorted cards for reference and planning.


Launch
Arrange students in groups of 2. Distribute one set of pre-cut slips or cards to each group.
Ask students to take turns matching a group of 4 cards with representations of the same situation and explaining how they know the representations belong together. Emphasize that while one partner explains, the other should listen carefully, and the group should discuss any disagreements.
Design Principle(s): Optimize output; Cultivate conversation
Supports accessibility for: Attention; Social-emotional skills
Student Facing
Your teacher will give you a set of cards. Take turns with your partner to match a group of 4 cards that contain: a situation, an inequality that represents it, a graph that represents the solution region, and a solution written as a coordinate pair.
For each match that you find, explain to your partner how you know it’s a match.
For each match that your partner finds, listen carefully to their explanation. If you disagree, discuss your thinking and work to reach an agreement.
Record your matches.
Group 1
- situation: perimeter of a rectangle
- inequality:
- a solution:
- sketch of graph:
Group 2
- situation: jar of coins
- inequality:
- a solution:
- sketch of graph:
Group 3
- situation: honey and jam
- inequality:
- a solution:
- sketch of graph:
Group 4
- situation: a school trip
- inequality:
- a solution:
- sketch of graph:
Student Response
For access, consult one of our IM Certified Partners.
Activity Synthesis
Select groups of students to share their results and explain their rationales. After a group explains why they believe a set of cards belong together, ask if other groups reasoned about the matches the same way or if they approached the matching differently.
Attend to the language that students use in their explanations by giving them opportunities to describe the inequalities, graphs, or solutions more precisely.
Lesson Synthesis
Lesson Synthesis
Summarize the lesson by discussing students' work for the last activity (about bank accounts, concert tickets, and advertising packages) and inviting them to reflect on their reasoning process. Discuss questions such as:
- "Of the four things you were asked to do in the last activity—writing an inequality, graphing the solutions, identifying and interpreting a particular solution, and answering the question about the situation—which one did you find most challenging or prone to error?"
- "How is graphing linear inequalities using technology similar to graphing them by hand? How is it different?"
- "You have previously used technology to graph linear equations in two variables. How is graphing linear inequalities in two variables different than graphing equations?"
23.4: Cool-down - The Band Played On (5 minutes)
Cool-Down
For access, consult one of our IM Certified Partners.
Student Lesson Summary
Student Facing
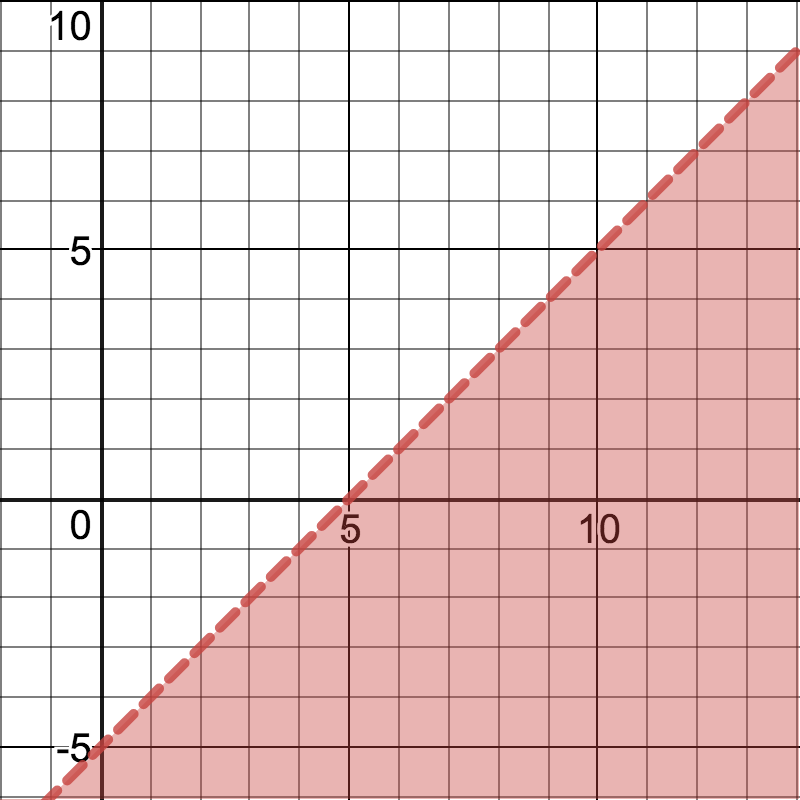
Suppose we want to find the solution to \(x - y > 5\). We can start by graphing the related equation \(x - y = 5\).
When identifying the solution region, it is important not to assume that the solution will be above the line because of a “>” symbol or below the line because of a “<” symbol.
Instead, test the points on the line and on either side of the line and see if they are solutions.

For \(x-y>5\), points on the line and above the line are not solutions to the inequality because the \((x,y)\) pairs make the inequality false. Points that are below the lines are solutions, so we can shade that lower region.
Graphing technology can help us graph the solution to an inequality in two variables.
Many graphing tools allow us to enter inequalities such as \(x-y >5\) and will show the solution region, as shown here.
Some tools, however, may require the inequalities to be in slope-intercept form or another form before displaying the solution region. Be sure to learn how to use the graphing technology available in your classroom.

Although graphing using technology is efficient, we still need to analyze the graph with care. Here are some things to consider:
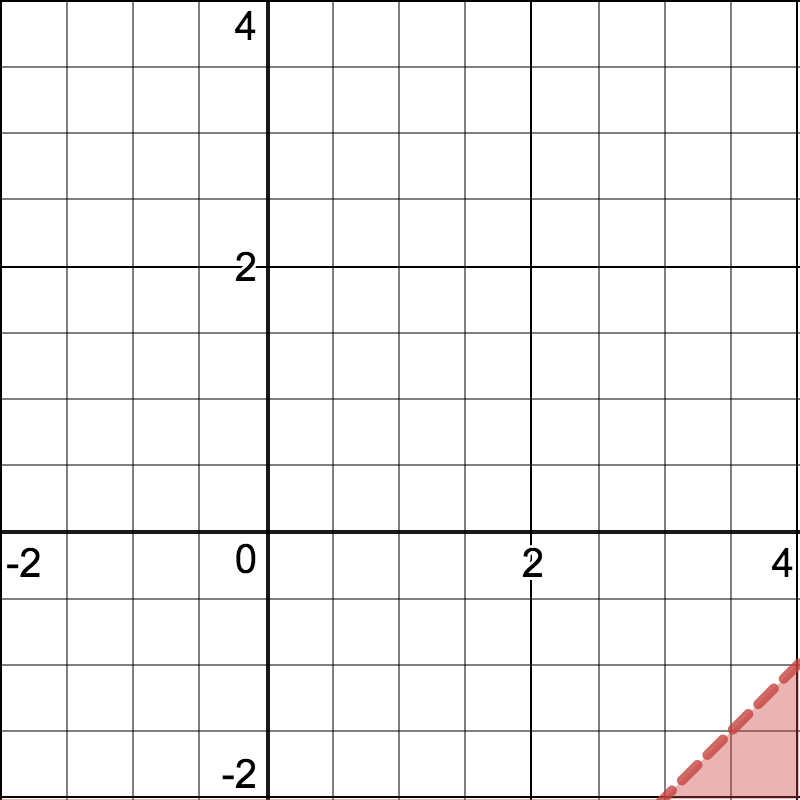
- The graphing window. If the graphing window is too small, we may not be able to really see the solution region or the boundary line, as shown here.
- The meaning of solution points in the situation. For example, if \(x\) and \(y\) represent the lengths of two sides of a rectangle, then only positive values of \(x\) and \(y\) (or points in the first quadrant) make sense in the situation.


