Lesson 9
Using Technology for Statistics
- Let’s explore technology used to represent data and calculate statistics.
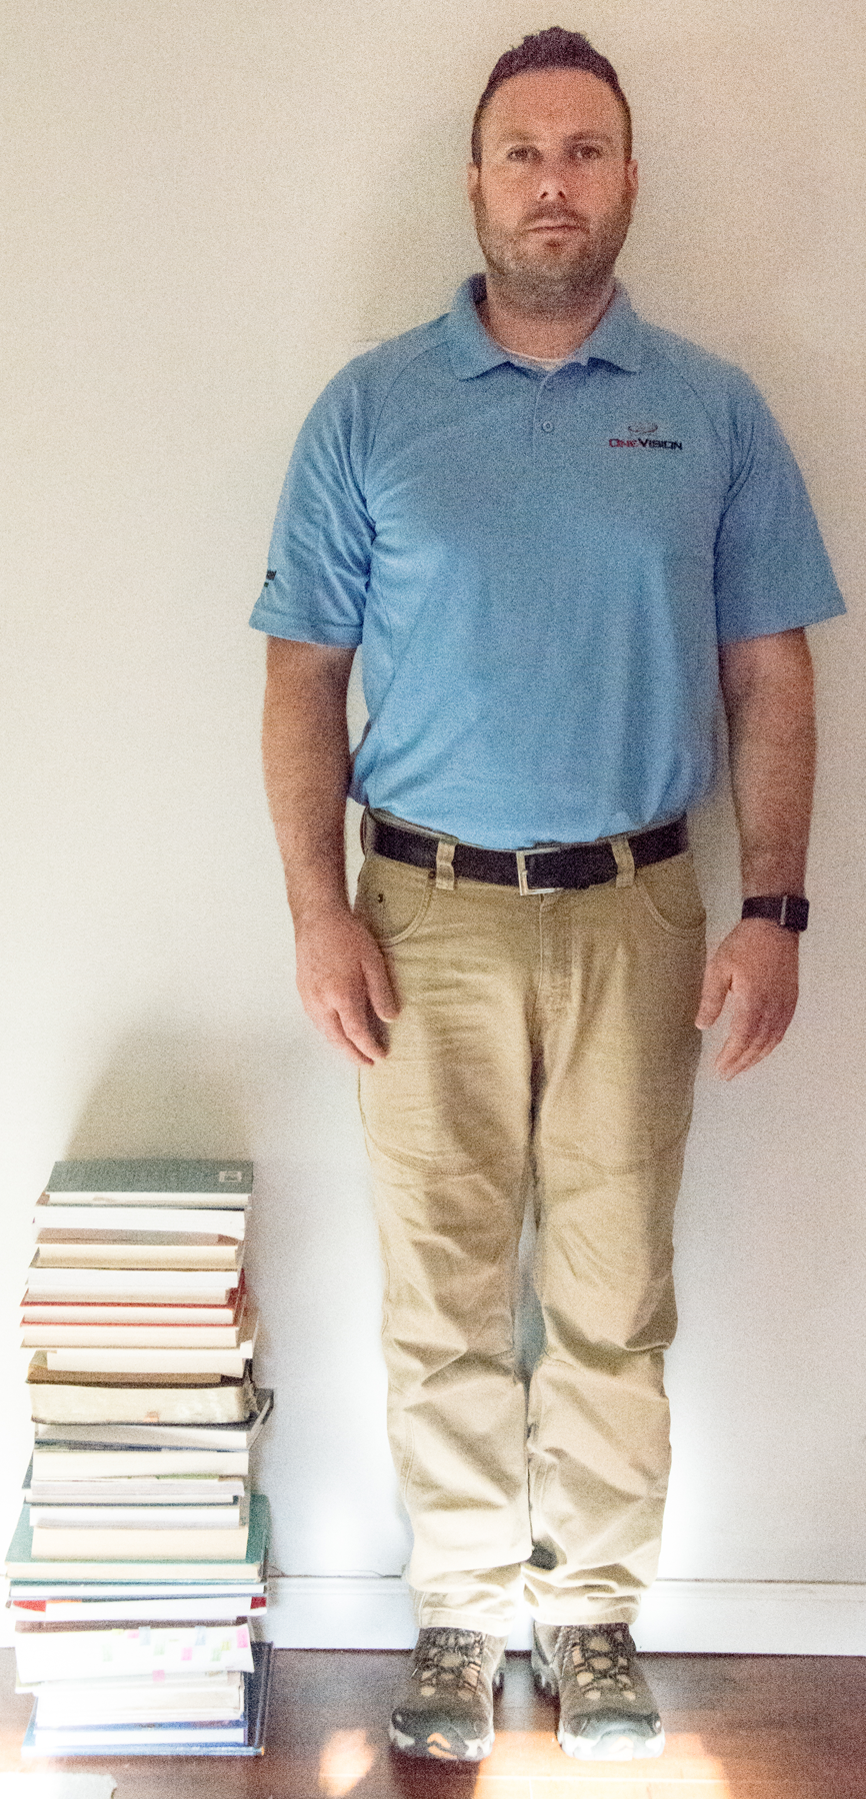
9.1: Estimation: Stack of Books

How tall is the stack of books?
- Record an estimate that is:
too low about right too high - Explain your reasoning.
9.2: Spreadsheet Statistics
Here is a list of the number of pages for fiction books on a shelf.
- 15
- 243
- 426
- 175
- 347
- 186
- 236
- 394
- 170
- 412
- 242
- 479
- 185
- 254
- 186
- 278
- 277
- 278
- 486
- 207
- 378
- 251
- 458
- 360
- 440
- 181
- 349
- 482
- 382
- Describe a method to find the mean of these values. (Do not calculate the value yet.)
- Input the data into a spreadsheet in the same column. In another column, write a spreadsheet formula that will compute the value of the mean for the values in the column. What is the mean number of pages in these books?
- The first book on the list with 15 pages was a recording error and should have been 158 pages. You need to compute the new mean using 158 instead of 15. Would you rather compute the new mean by hand or use a computer? Explain your reasoning.
- What is the new mean number of pages in these books with the updated value of 158 pages for the first book in the list?
- Another book is found and added to the shelf. This new book has 519 pages. How would you update your spreadsheet formula to include this new value?
9.3: Which Data Display?
For each set of data, select the data display that is most informative, then explain your reasoning.
The total area of 50 U.S. states in thousands of square kilometers.


The population of the 50 U.S. states in thousands of people.


The population density of 50 U.S. states in people per square mile.


