Lesson 16
Compare & Contrast
- Let’s analyze data
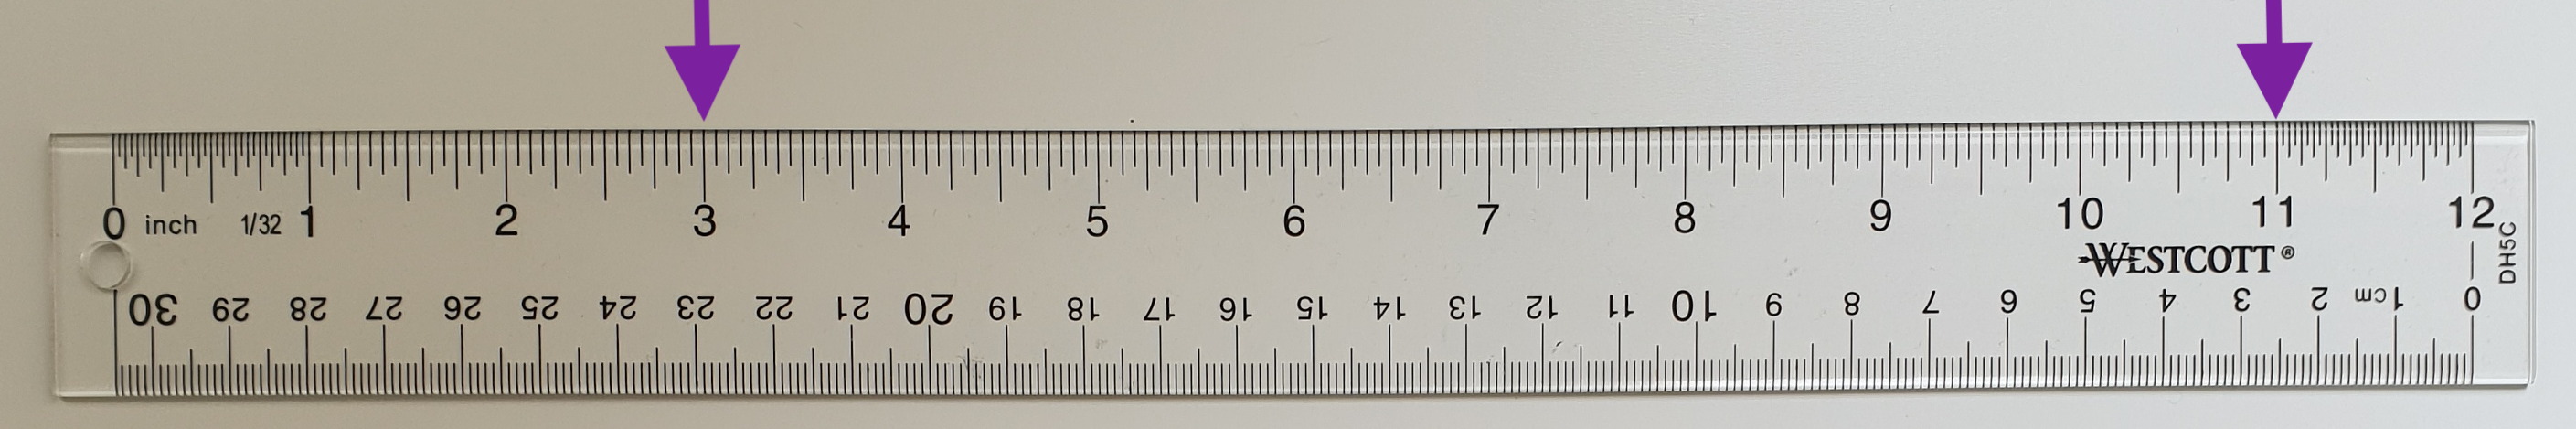
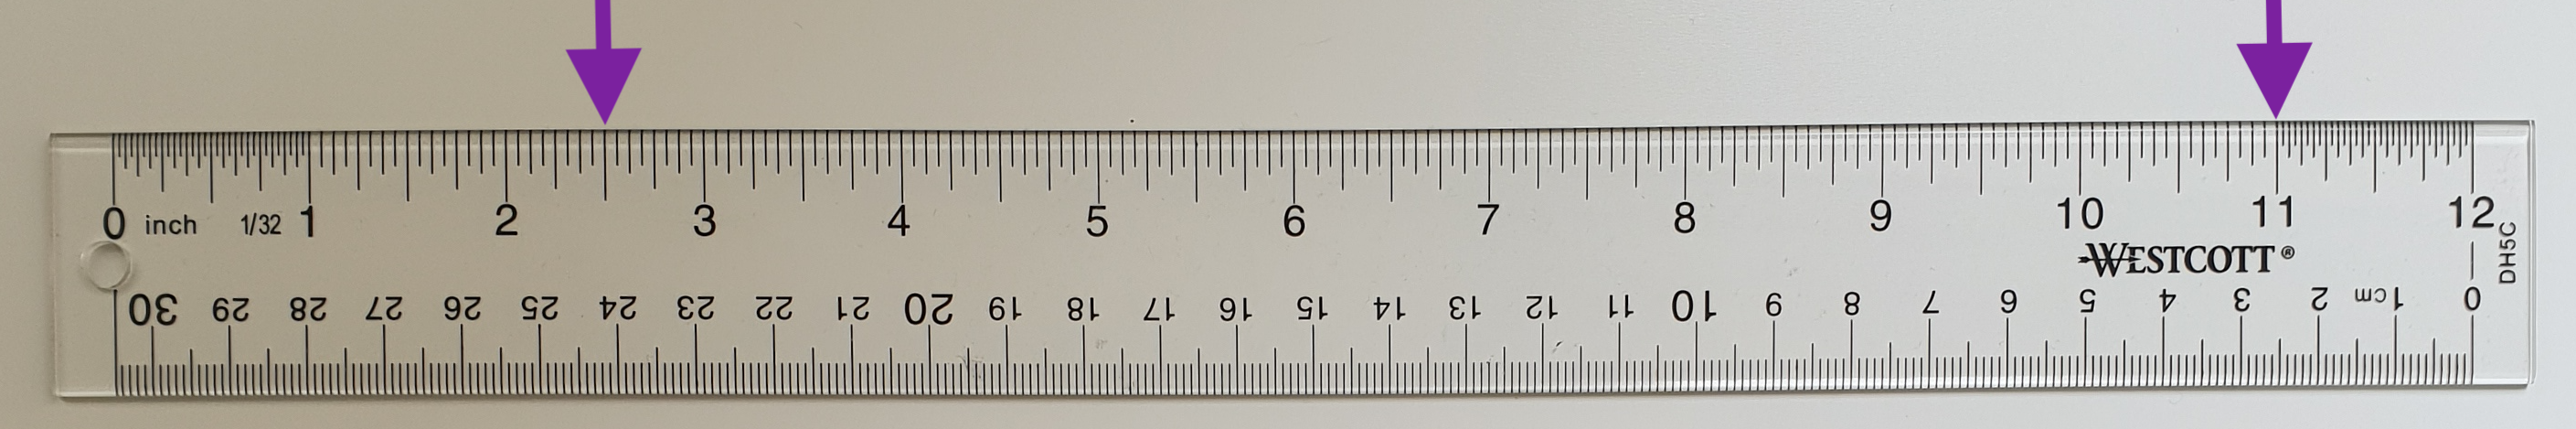
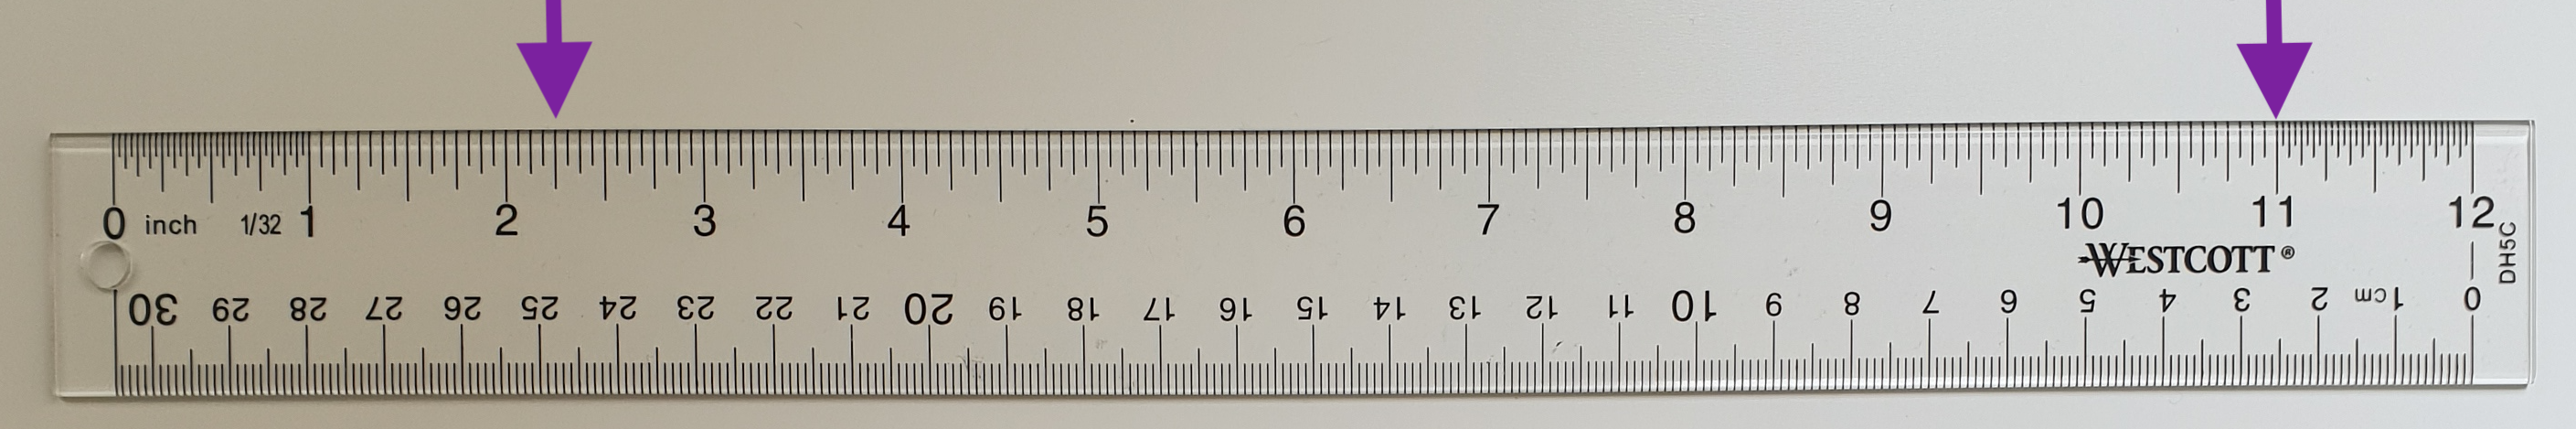
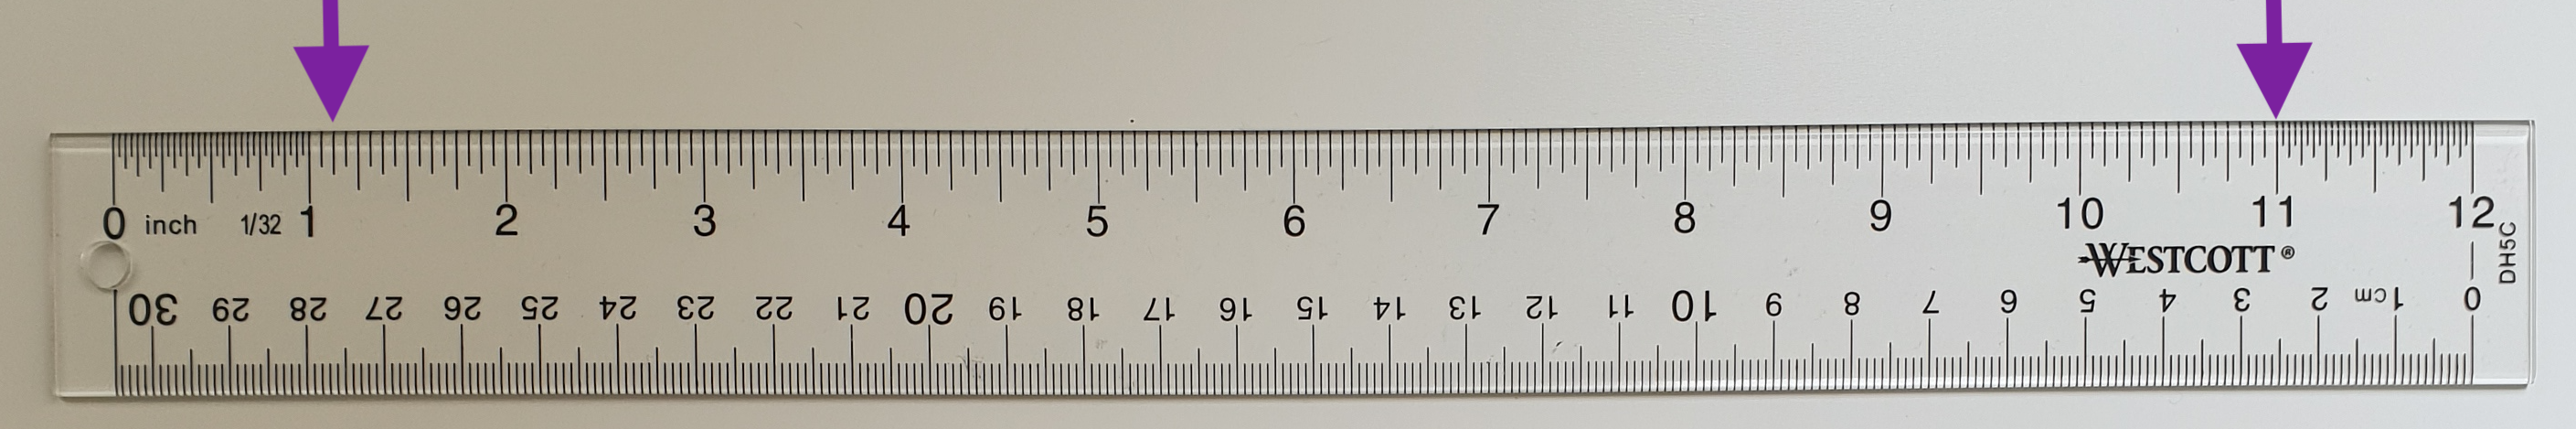
16.1: Math Talk: Measuring Up
What is the distance between the markings?
![Image of ruler. Arrow at 3 inches and 11 inches.](https://cms-im.s3.amazonaws.com/oFPRkzEN1oZVnk8E3gRSyYUQ?response-content-disposition=inline%3B%20filename%3D%22S1x.13.ruler1.png%22%3B%20filename%2A%3DUTF-8%27%27S1x.13.ruler1.png&response-content-type=image%2Fpng&X-Amz-Algorithm=AWS4-HMAC-SHA256&X-Amz-Credential=AKIAXQCCIHWF3XOEFOW4%2F20240727%2Fus-east-1%2Fs3%2Faws4_request&X-Amz-Date=20240727T002618Z&X-Amz-Expires=604800&X-Amz-SignedHeaders=host&X-Amz-Signature=41d217b3ea3441b460c43371238d1028b64ec712f4c15cdb911ee85a7a7ecfcf)
![Image of ruler. Arrow at 2 point 5 inches and 11 inches.](https://cms-im.s3.amazonaws.com/vDYgCZcktddTKCtcTYU3jzk2?response-content-disposition=inline%3B%20filename%3D%22S1x.13.ruler2.png%22%3B%20filename%2A%3DUTF-8%27%27S1x.13.ruler2.png&response-content-type=image%2Fpng&X-Amz-Algorithm=AWS4-HMAC-SHA256&X-Amz-Credential=AKIAXQCCIHWF3XOEFOW4%2F20240727%2Fus-east-1%2Fs3%2Faws4_request&X-Amz-Date=20240727T002618Z&X-Amz-Expires=604800&X-Amz-SignedHeaders=host&X-Amz-Signature=66b15d27edf2e0b0fd98e27cbe07548825f69e986e70706f4e54ca6a88e60da9)
![Image of ruler. Arrow at 2 point 25 inches and 11 inches.](https://cms-im.s3.amazonaws.com/cdZtcrBNU32dEcVuDdJ8PtzW?response-content-disposition=inline%3B%20filename%3D%22S1x.13.ruler3.png%22%3B%20filename%2A%3DUTF-8%27%27S1x.13.ruler3.png&response-content-type=image%2Fpng&X-Amz-Algorithm=AWS4-HMAC-SHA256&X-Amz-Credential=AKIAXQCCIHWF3XOEFOW4%2F20240727%2Fus-east-1%2Fs3%2Faws4_request&X-Amz-Date=20240727T002618Z&X-Amz-Expires=604800&X-Amz-SignedHeaders=host&X-Amz-Signature=35d8ae062ce8a75dae107ac71ccbad08b4a183e5bfa0d5369d29e08c036d5ddb)
![Image of ruler. Arrow at 1 and one eighth inches and 11 inches.](https://cms-im.s3.amazonaws.com/dGzxkJhwRrDfG4fgnF3SJWee?response-content-disposition=inline%3B%20filename%3D%22S1x.13.ruler4.png%22%3B%20filename%2A%3DUTF-8%27%27S1x.13.ruler4.png&response-content-type=image%2Fpng&X-Amz-Algorithm=AWS4-HMAC-SHA256&X-Amz-Credential=AKIAXQCCIHWF3XOEFOW4%2F20240727%2Fus-east-1%2Fs3%2Faws4_request&X-Amz-Date=20240727T002618Z&X-Amz-Expires=604800&X-Amz-SignedHeaders=host&X-Amz-Signature=b8d51bd08dc0ed252eadc1d4bdcb43d4ab122753dae17404fe656a44c7d75402)
16.2: Compare & Contrast
Here are the shoe sizes from two cohorts in the military.
Cohort A:
Cohort B:
- Is there any overlap between the two data sets? Explain your reasoning.
- Which cohort has more variability?
- Does at least one person from cohort A have a bigger shoe size than someone from cohort B? Explain your reasoning.
- Compare the measures of center.
16.3: Compare & Contrast Continued
![Many shoes on the floor](https://cms-im.s3.amazonaws.com/x32Lf8Yc3nLUCLFExwvkjeJz?response-content-disposition=inline%3B%20filename%3D%22shoes.jpg%22%3B%20filename%2A%3DUTF-8%27%27shoes.jpg&response-content-type=image%2Fjpeg&X-Amz-Algorithm=AWS4-HMAC-SHA256&X-Amz-Credential=AKIAXQCCIHWF3XOEFOW4%2F20240727%2Fus-east-1%2Fs3%2Faws4_request&X-Amz-Date=20240727T002618Z&X-Amz-Expires=604800&X-Amz-SignedHeaders=host&X-Amz-Signature=0193259c107d543f7b0e98dfe1fb19a09908b4c2fbfc4b6c21a48141be85d1a3)
Here are the shoes sizes of some grade 9 and grade 12 students.
Grade 9 shoe sizes:
- 6
- 8
- 6.5
- 7.5
- 7
- 6.5
- 9
- 6
- 8.5
- 7.5
- 8
- 10
- 11
- 8
- 9
Grade 12 shoe sizes:
- 10
- 9
- 10.5
- 8.5
- 10
- 9
- 9.5
- 8
- 8
- 11
- 9
- 9.5
- 11
- 10.5
- 8.5
- Create a box plot, dot plot, or histogram to represent both sets of data.
- Describe the distribution shapes.
- Complete the table.
mean median IQR standard deviation grade 9
shoe sizesgrade 12
shoe sizes - Does one grade’s shoe sizes have more variation than the other? Explain how you know.
- Compare the measures of center for the two sets of shoe sizes.
- Do the distributions overlap? Use the data display you created to explain how you know.