Lesson 10
Measures of Center
- Let’s explore the relationship between measures of center and the shape of data.
10.1: Estimation: Lamp Post
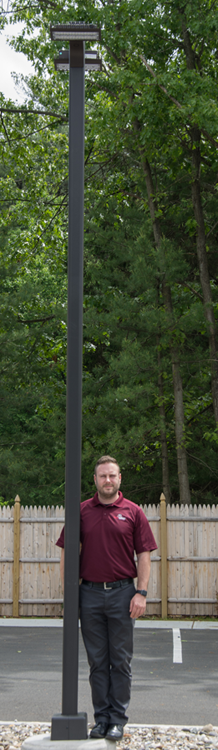
How tall is the lamp post?
- Record an estimate that is:
too low about right too high - Explain your reasoning.
10.2: Balance Point
Navigate to https://www.geogebra.org/m/HHy53Nfj
- For each data set, move the points in the applet so that the data set is represented. Then, move the balance point to where you predict it to be. Release the bar to see if you were correct. Continue until you find the balance point.
- 5, 6, 6, 7, 7, 7, 7, 8, 8, 9
- 0, 0, 8, 8, 9, 9, 9, 9, 9, 9
- 0, 2, 2, 3, 3, 3, 4, 4, 9, 10
- Compute the mean and the median for each data set. What do you notice?
10.3: Mean vs. Median
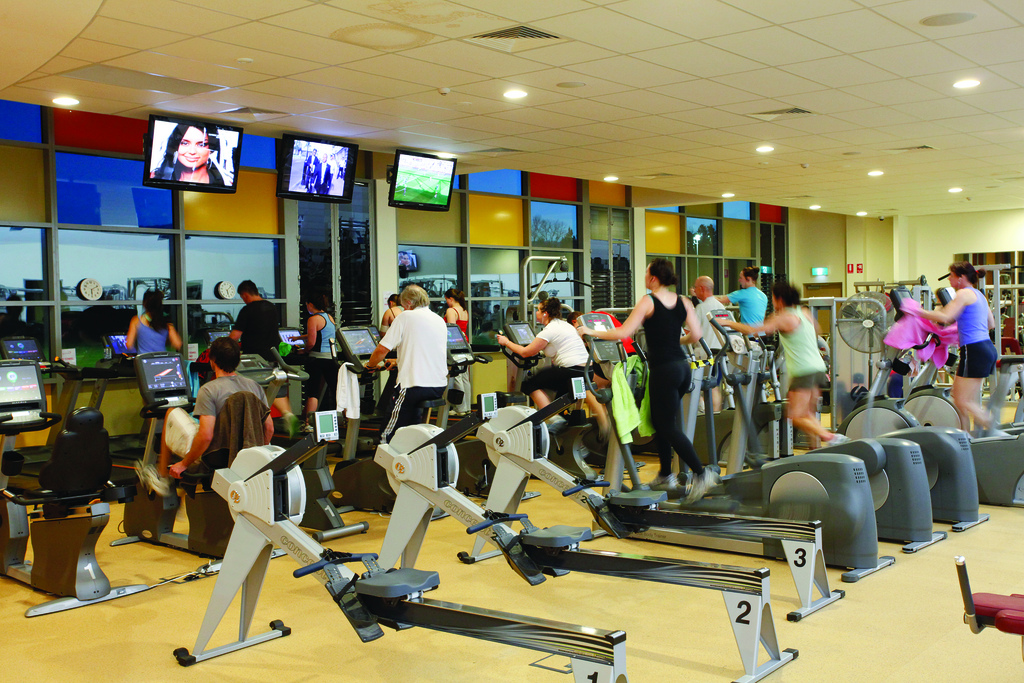
When people join a gym, they are assessed on their fitness by doing several exercises. The results are given as a score between 1 and 100 with 100 representing peak fitness for the person’s age. The gym claims they can improve scores for members after only 2 months.
After 2 months, 11 people are assessed again, and the number of points they improve on in the assessment is shown in the dot plot.

- What is the mean improvement among these members?
- What is the median?
- Which measure of center is a better representation of the members’ improvement? Explain your reasoning.