Lesson 16
Heart Rates
Let’s collect and analyze data.
16.1: Find Your Heart Rate
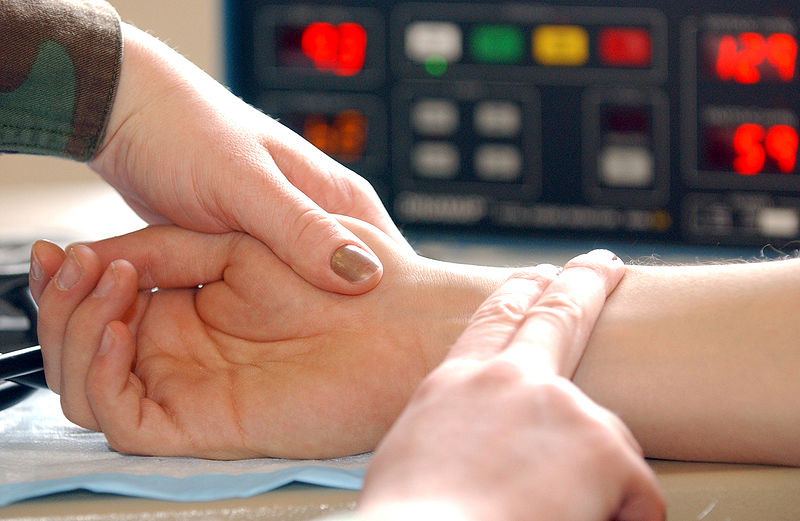
Find your heart rate. One way is to place your index and middle fingers on your neck just below the jaw to feel your heartbeat. Count the number of heartbeats you feel in 10 seconds. Multiply the value by 6 to find your heart rate in beats per minute (bpm).
- Write the value for your heart rate in bpm. This will be used as your resting heart rate.
- Take some deep breaths, close your eyes, and repeat the process. Write the value for your heart rate in bpm. Has your heart rate changed?
16.2: The Counting Experiment
Does counting while exercising affect your heart rate? Let’s perform an experiment to find out.
- Your teacher will help divide you into two groups and lead the exercise. If you are selected to be in the group that will count during the exercise, count out loud together with your group while you do the exercise. If you are selected to be in the group that will remain silent during the exercise, remain quiet.
- Immediately following the exercise, measure your heart rate again. Count the number of beats in ten seconds and multiply the result by 6 to get your heart rate in beats per minute. Record this result. Find the difference in heart rate by subtracting your heart rate after exercise from the resting heart rate you found during the warm-up.
16.3: The Flapping Experiment
Does the way you do an exercise affect your heart rate? Let’s perform an experiment to find out.
- Your teacher will help divide you into two groups and lead the exercise. If you are selected to be in the group that will do jumping-jacks during the exercise, do the standard exercise using your arms and legs. If you are selected to be in the group that will only flap their arms, move your arms as in a jumping-jack, but do not jump or move your legs.
- Immediately following the exercise, measure your heart rate again. Count the number of beats in ten seconds and multiply the result by 6 to get your heart rate in beats per minute. Record this result. Find the difference in heart rate by subtracting your heart rate after exercise from the resting heart rate you found during the warm-up.
16.4: Analyzing the Heart Rates
- Using the data for the increase in heart rates, find the mean for each group.
- Find the difference between the means for the two groups by subtracting the mean for the first group from the mean for the second group. What does a positive value mean? What does a negative value mean?
- Does the difference in means tell us that there is an effect on heart rate? If so, explain the connection. If not, what else could account for the difference in means?
- Since the groups were divided using a random process, the only reasons there should be a difference in means is if the treatment had an affect or if it was due to the random assignment to groups. To rule out random assignment as the explanation for the observed difference, assume for a bit that the different treatments had no effect on the increase in heart rate. In this case, we could shuffle around some of the results from the two groups and still have a similar outcome. Let’s examine what happens when we do this randomization experiment.
- Cut a sheet of paper into pieces so there are as many pieces as students in the class. Write the data from the experiment on the pieces so that each piece has one value on it.
- Shuffle the pieces and select half of them to represent the first group. Give the other pieces to your partner to represent the second group.
- Find the mean for each group and record the difference in the means by subtracting the mean for the first group from the mean for the second group.
- Repeat this process 4 more times so that you have recorded 5 differences in means from the randomization process.
- Share your data with the class and examine the randomization distribution in the histogram of the difference in means. This distribution represents some of the differences that are possible due only to random assignment to experimental groups. Estimate the center of the distribution. What does this value mean in terms of heart rates for the two groups when reassigned at random?
- Does the difference for your class from the actual experiment represent a typical value for this distribution, or is it unusual?
Summary
A randomization distribution is used to determine if the difference between the means of different treatment groups could be due to chance.
A company farms a type of fish called tilapia. They conduct an experiment to determine if a freshwater environment, treatment A, or a slightly salty environment, treatment B, causes the fish to grow at a faster rate. The table displays the weight gain, in grams, of a random sample of 11 tilapia from treatment A and a random sample of 11 tilapia from treatment B.
| treatment A weight gain (grams) | treatment B weight gain (grams) |
|---|---|
| 120 | 120 |
| 125 | 130 |
| 115 | 135 |
| 135 | 125 |
| 110 | 135 |
| 125 | 125 |
| 130 | 130 |
| 120 | 130 |
| 125 | 125 |
| 120 | 135 |
| 125 | 130 |
The mean weight gain of the sample from treatment A is approximately 122.7 grams and the mean weight gain of the sample from treatment B is approximately 129.1 grams, a difference of approximately -6.4 grams.
The results for 100 trials of simulating redistributing the data are summarized in the histogram.

Only 2 out of 100 trials for the simulation show a weight gain difference between the groups of at least 6 grams. Since the difference between the mean weight gains from the treatment groups is -6.4 grams, we can say we have good evidence that the difference did not occur by chance. Therefore, there is evidence that the saltiness of the water in which the tilapia are grown does have an effect on the weight gain of the fish grown in that environment.
Glossary Entries
- treatment
In an experiment where you are comparing two groups, one of which is being given a treatment and the other of which is the control group without any treatment, the treatment is the value of the variable that is changed for the treatment group.