Lesson 10
Estimating Proportions from Samples
- Let’s estimate population proportions with some data.
10.1: Math Talk: Proportions
Mentally evaluate the proportion of chips that are blue.
17 are blue out of 50 chips
28 are blue out of 50 chips
17 are blue out of 20 chips
21 are blue out of 60 chips
10.2: Pass or Fail
Your teacher will give you a bag with paper slips inside that are marked as either Pass or Fail. Do not empty the bag to look at all of the contents at once.
- One partner should hold the bag so that the other partner cannot see inside while they draw a slip of paper. The other partner should draw 10 slips of paper from the bag, one at a time. After the 10 slips are drawn, record the number of slips marked Pass.
- From the results of the first trial, estimate the proportion of the slips in the bag that are marked Pass.
-
Switch roles with your partner and repeat the process until you have run 5 trials. For each trial, compute the proportion of slips you drew that are marked Pass.
trial 1 2 3 4 5 number of Pass slips proportion of slips marked Pass - Create a dot plot based on the trials from the class that shows the proportion of slips drawn that are marked Pass.
- From the class dot plot, estimate the proportion of slips marked Pass in the bag. Explain your reasoning.
10.3: Fly Memory
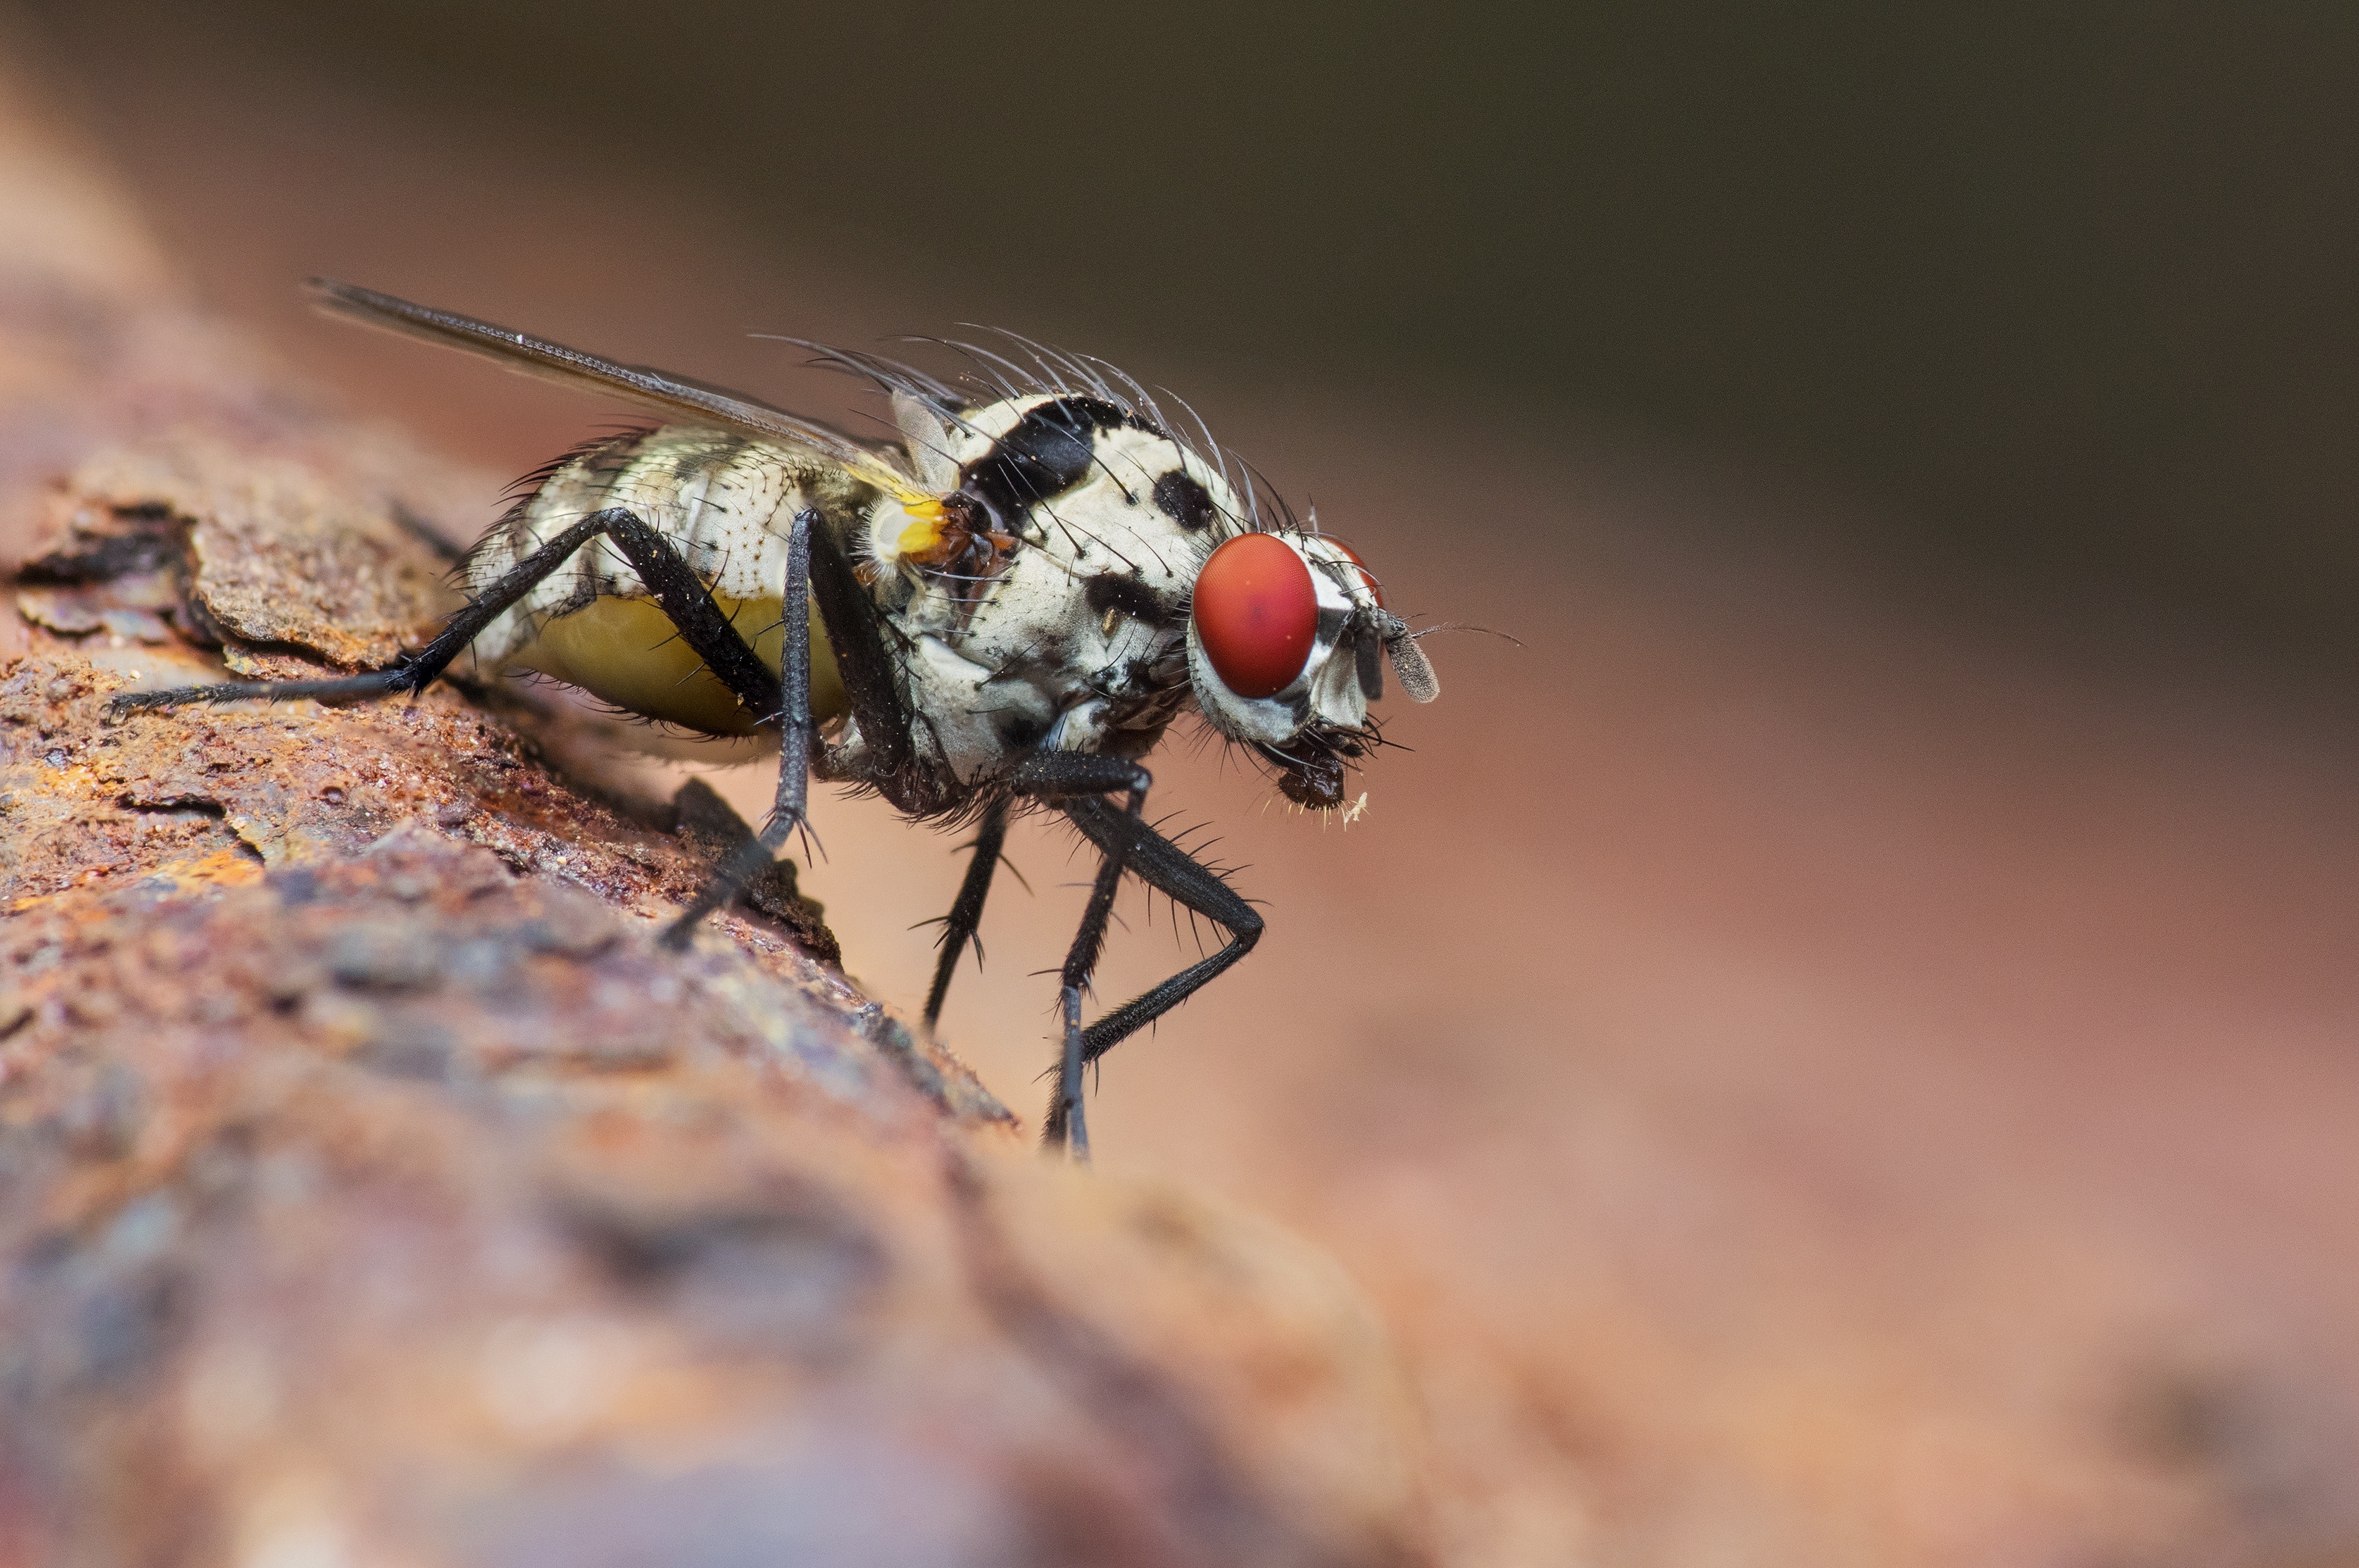
A biologist is breeding fruit flies to include a specific genetic mutation that will be useful in understanding memory in humans. To check whether a fly has the mutation, a DNA sequence is analyzed in a way that kills the fly, so the biologist only wants to test a sample of the flies to estimate the proportion of flies that have the mutation.

The biologist selects 40 flies to sequence at random and finds that 9 of them have the genetic mutation.
- Based on this sample, estimate the proportion of flies in this group that has the genetic mutation.
- The scientist is worried that only having one sample may not be reliable for estimating the proportion of flies with the mutation, but does not want to sacrifice more flies to get a larger sample. The proportion from the sample is a good estimate for the population proportion, but it is difficult to understand the possible variability from a single value. Andre has a suggestion for how to better understand the variability:
- Assume the sample is representative of the population of flies and create a simulation that mimics what the scientist found. Andre gets 200 pieces of paper and marks 45 of them as Mutant and puts them all in a bag. Since Andre decided to use 200 pieces of paper, why should 45 of them be marked Mutant? What are some other combinations of total number of pieces of paper and number marked Mutant that he could use?
- Andre then simulates the scientist’s sample by drawing a slip of paper from the bag noting whether it is Mutant or not, then replacing the paper into the bag and drawing another paper until he has a sample of 40. He repeats this process for 50 trials and creates a dot plot showing the proportion that are Mutant from each trial. Estimate values on the dot plot a range of proportions that include about 95% of the proportions from the trials.
- Andre then finds the mean proportion from his simulations to be 0.2195 and the standard deviation to be 0.06. How far are your values from the last question from the mean? This will represent your estimated margin of error.
- Divide the distance from the last question by the standard deviation to get the margin of error in terms of the number of standard deviations.
- Based on Andre’s simulations, should the scientist feel confident that the proportion of flies is within two standard deviations of the mean for the simulations?
Suppose the biologist breeds 600 flies. What is the minimum number of flies the biologist should expect to have the mutation based on Andre’s margin of error? What is the maximum that should be expected?
Summary
Although reality doesn’t always match up with our estimates, using sample data to estimate a characteristic for a larger group can be very useful, especially when you attach a margin of error to the estimate. It is unlikely that an estimate will differ from the population characteristic that is being estimated by more than the margin of error.
For example, a lumber manufacturer may be worried about the number of boards it produces that are not straight. It would be too time consuming and costly to check every board, but they can check 50 boards each day to get an idea of the proportion of boards that are not straight. After a month of checking daily, they examine the distribution of the samples and determine that the standard deviation for the proportions is about 0.02.
The next day, their sample has 15 boards that are not straight out of the 50 checked. The manufacturer should estimate that the proportion of boards that are not straight for that day is about 0.3 (since \(\frac{15}{50} = 0.3\) ) with a margin of error of 0.04 (since twice the standard deviation is \(2 \boldcdot 0.02 = 0.04\)). That means that the actual proportion of boards that are not straight that are produced that day is most likely between 0.26 and 0.34.
Glossary Entries
- margin of error
The maximum expected difference between an estimate for a population characteristic and the actual value of the population characteristic.
