Lesson 10
Piecewise Linear Functions
Let’s explore functions built out of linear pieces.
Problem 1
The graph shows the distance of a car from home as a function of time.

Describe what a person watching the car may be seeing.
Problem 2
The equation and the graph represent two functions. Use the equation \(y=4\) and the graph to answer the questions.
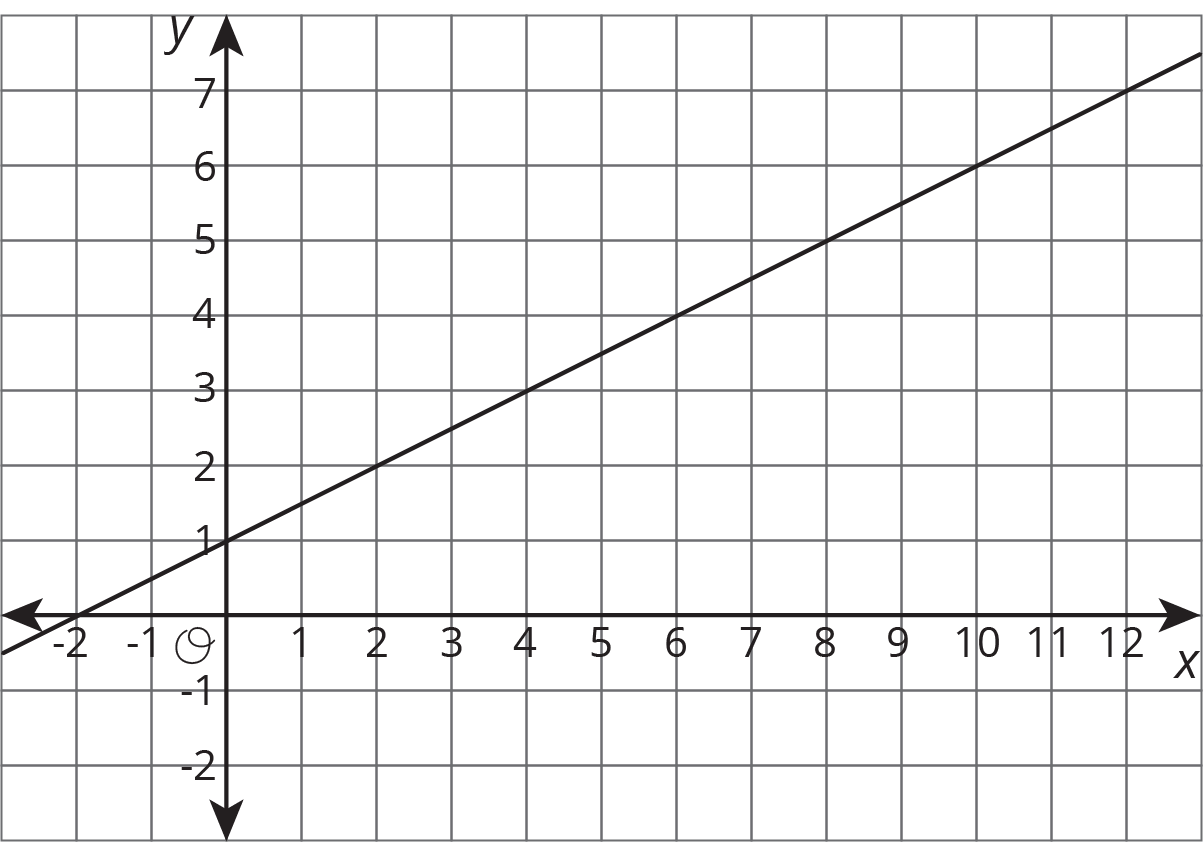
- When \(x\) is 4, is the output of the equation or the graph greater?
- What value for \(x\) produces the same output in both the graph and the equation?
Problem 3
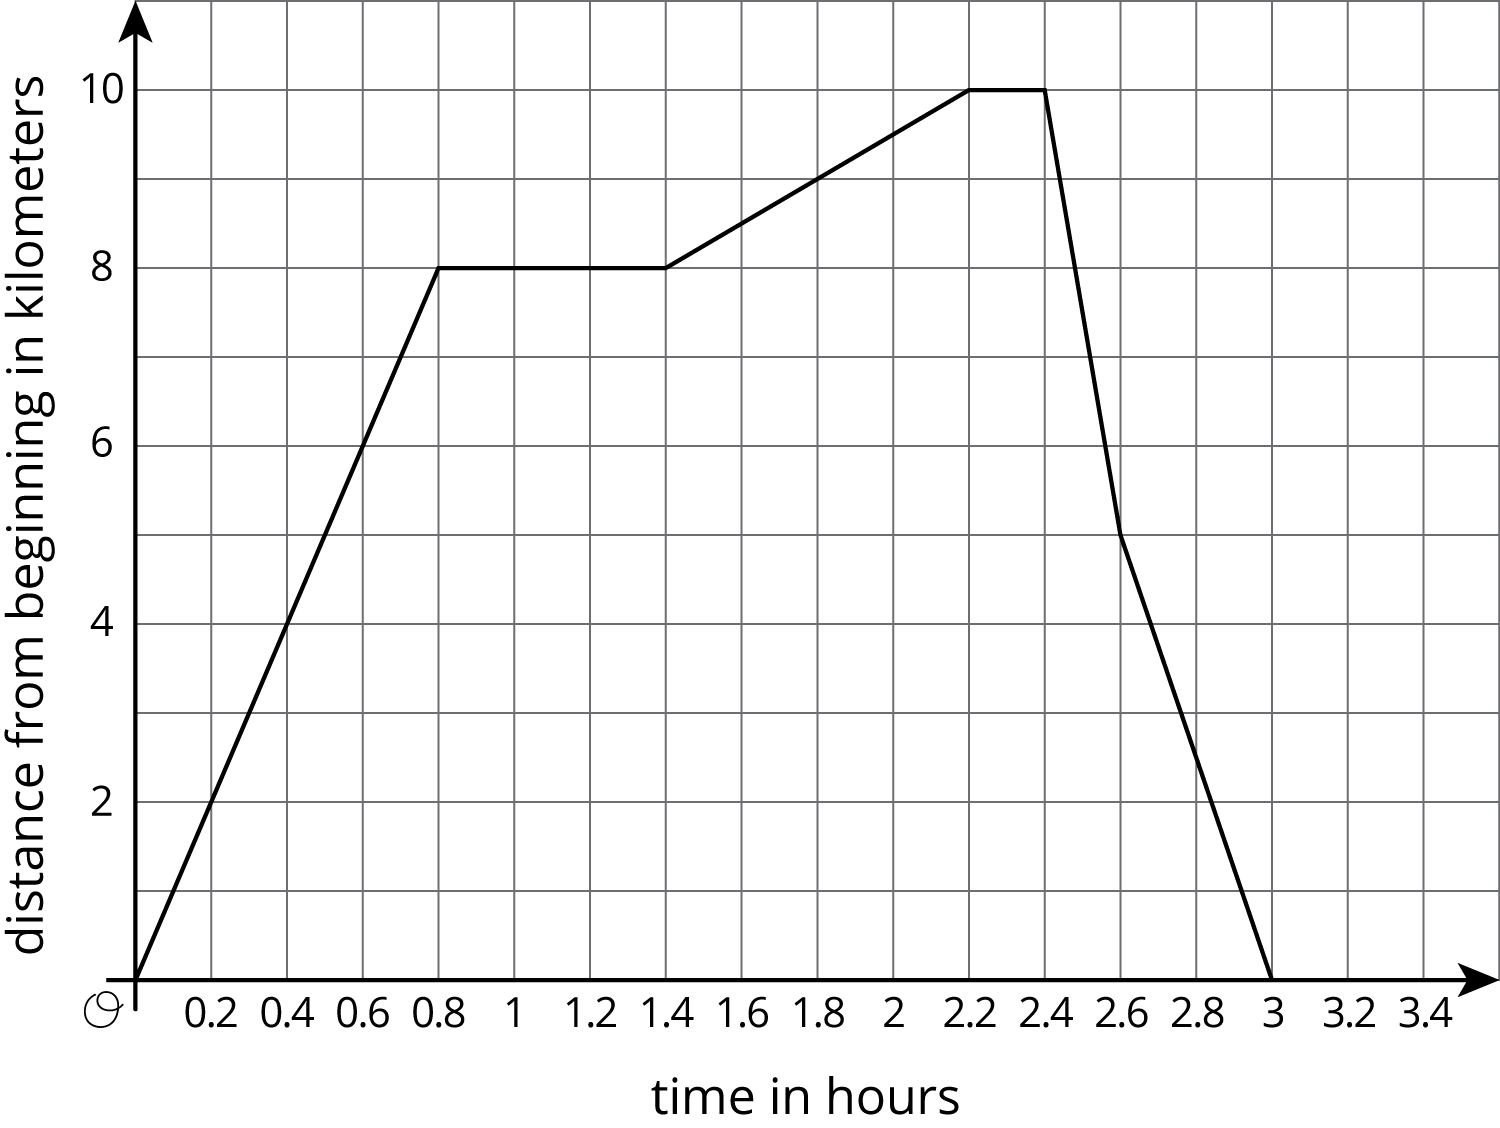
This graph shows a trip on a bike trail. The trail has markers every 0.5 km showing the distance from the beginning of the trail.
-
When was the bike rider going the fastest?
-
When was the bike rider going the slowest?
-
During what times was the rider going away from the beginning of the trail?
-
During what times was the rider going back towards the beginning of the trail?
-
During what times did the rider stop?
Problem 4
The expression \(\text-25t+1250\) represents the volume of liquid of a container after \(t\) seconds. The expression \(50t+250\) represents the volume of liquid of another container after \(t\) seconds. What does the equation \(\text-25t+1250=50t+250\) mean in this situation?