Lesson 4
Using Technology to Work with Sequences
4.1: Where Does It Live? (10 minutes)
Warm-up
The purpose of this activity is for students to write, read, and evaluate expressions using cells in a spreadsheet. This warm-up directly prepares students for the following activities, where they will study the structure of sequences using technology.
Launch
Provide access to devices that can run GeoGebra or other spreadsheet technology for each student. If students are using the digital version of the materials, show them how to open the GeoGebra Spreadsheet in the math tools.
Tell students that in a spreadsheet, each “cell” has an address given by its column and row. For example, cell B3 is in the second column and the third row.
Arrange students in groups of 2. It is recommended that students not be expected to write down responses to the questions in this task, but rather discuss them with their partner.
Student Facing
Follow your teacher’s instructions to open a blank spreadsheet.
Type the following in each cell:
In A1, type 2
In A2, type 3
In A3, type -10
In A4, type 1/5
In B1, type =A1+A2
In B2, type =A3*A4
In B3, type =B1+333
In B4, type =abs(B2)
- Look at the numbers that appear in B1, B2, B3, and B4 after you press enter. Where did these numbers come from?
- Experiment with typing some different values in A1, A2, A3, and A4. Describe what happens.
- Experiment with typing some new formulas in some new cells.
- Can you figure out how to raise a number to a power?
- What happens if you forget to start a formula with the = symbol?
Student Response
For access, consult one of our IM Certified Partners.
Activity Synthesis
If time allows, students can challenge each other to guess a formula. For example, one student puts some numbers into column A and a secret formula into column B. The partner changes the numbers in A to see what happens in the cell with the formula and tries to guess the formula. (They have to agree to not cheat by clicking on the formula cell.)
4.2: Fill Down (10 minutes)
Optional activity
Building on their work in the warm-up, students now generate the terms of geometric and arithmetic sequences using a spreadsheet.
Launch
Provide access to devices that can run GeoGebra or other spreadsheet technology.
Design Principle(s): Optimize output (for explanation); Maximize meta-awareness
Student Facing
-
Open a blank spreadsheet. In A1, type 10 and enter.
-
In A2, type =A1+3 and enter.
-
Click once on cell A2 to highlight it. See the little + in the lower-right corner? Click and drag it down to highlight several rows in that column and then let go. (This is known as “fill down.”) Describe what happens.
-
What simple thing can you edit so that column A shows the sequence 12, 15, 18, . . .?
-
What simple things can you edit so that column A shows the sequence 12, 11, 10, . . .?
-
-
In B1, type 16 and enter.
-
In B2, type =B1*0.5 and enter.
-
Click on cell B2 and fill down. Describe what happens.
-
What simple thing can you edit so that column B shows the sequence 10, 5, 2.5, . . .?
-
What simple things can you edit so that column B shows the sequence 10, 30, 90, . . .?
-
-
In column C, starting at C1 and going down, type these terms of a geometric sequence: 700, 70, 7, 0.7, 0.07
-
In cell D2, type =C2/C1. What is the result?
-
What is the meaning of the result?
-
Click on cell D2 and fill down. What happens?
-
-
In column E, starting at E1 and going down, type these terms of an arithmetic sequence: 7, 10.5, 14, 17.5
-
In cell F2, type =E2-E1. What is the result?
-
What is the meaning of the result?
-
Click on cell F2 and fill down. What happens?
-
-
Use the spreadsheet to decide whether the sequence 8, 12, 18, 27, 40.5 is arithmetic or geometric, and find its rate of change or growth factor.
-
Use the spreadsheet to decide whether the sequence 50, 42.1, 34.2, 26.3 is arithmetic or geometric, and find its rate of change or growth factor.
Student Response
For access, consult one of our IM Certified Partners.
Student Facing
Are you ready for more?
Open a blank spreadsheet. In column A, starting in A1 and going down, enter the numbers 0 through 9. What could you type into B1 and then fill down to the 10th row that gives the first 10 terms of a linear function whose rate of change is 2 and vertical intercept is 5?
Student Response
For access, consult one of our IM Certified Partners.
Activity Synthesis
Select students to share how they used the spreadsheet to identify the type of sequence and the rate of change or growth factor of the sequence in the final two questions.
4.3: Plot Some Points (15 minutes)
Optional activity
In this activity, students learn how to use graphing technology to plot points by entering data into a table.
Launch
Keep students in the same groups. It is recommended that students not be expected to write down answers to the questions, but rather check in with their partner until they are satisfied that they know how to use the tool.
Provide access to devices that can run Desmos or other graphing technology. Instruct students on how to create a new table using the graphing technology available in your classroom. These instructions use the Desmos graphing calculator.
-
Open a Desmos graphing calculator window either from the math toolkit in the digital version of the student materials or by navigating a browser to desmos.com/calculator.
-
Show students that in the expression list, you can type something like (1,3) and a point is plotted.
-
What if we want to plot several points efficiently? We can make a table. Find the + button in the expression list and select “table.”
-
Start typing numbers under x_1 and y_1. Note that these pairs are plotted as points in the coordinate plane. Give students time to complete all parts of the first question.
-
-
To make the values in one column a function of the other:
-
In a new table, replace the y_1 with an expression in terms of x_1. For example, 3 * x_1 + 1.
-
Type 0 in the first row under x_1, and then 1 in the next row. If you then keep pressing enter, the x_1 column should automatically increment by 1 and the other column should automatically compute the output.
-
Show students how to zoom the graphing window out to see more points, either using the + button on the upper-right or scrolling your touchpad.
-
Supports accessibility for: Conceptual processing; Visual-spatial processing
Student Facing
-
Open a graphing utility and follow your teacher’s instructions to create a new table with 2 columns. Learn how the 2 numbers in each row can be plotted as points in the coordinate plane.
-
Change the numbers in the table so that all of the plotted points lie along a diagonal line with a positive slope.
-
Change the numbers in the table so that all of the plotted points lie along a horizontal line.
-
Change the numbers in the table so that the graph created does not represent a function.
-
-
Follow your teacher’s instructions to make one column a function of the other.
-
Change the expression in the second column so that the plotted points lie on a line with a different steepness.
-
Change the expression in the second column so that the plotted points do not lie on a line.
-
Change the table so that some of the points are plotted in the second quadrant of the graph (the upper-left quadrant).
-
Student Response
For access, consult one of our IM Certified Partners.
Activity Synthesis
Select students to share their graphs, highlighting how students plotted a graph that is not a function and how students changed the table to have points in two quadrants and any changing of the graphing window that resulted.
Lesson Synthesis
Lesson Synthesis
The goal of this lesson is for students to find a rule for a sequence and extend the number of its terms using technology. Here are some questions for discussion:
- “How do you create a table of values using technology?” (You type the input data and the output rule into the spreadsheet or table.)
- “What are some advantages of using technology to find a rule for a sequence and extend the number of its terms?” (The advantage of having the technology calculate the outputs is that I don’t need to repeat the computations by hand and I can see the long-term behavior of the sequence easily.)
- “When do you think it is appropriate to use technology to represent data or to calculate statistics?” (Using technology to calculate a table of values makes sense to do in most situations because the terms are calculated recursively, so to get to the 100th term, we need to do 100 calculations. The chance for making a mistake while calculating by hand makes using technology a good choice.)
4.4: Cool-down - Use a Spreadsheet (5 minutes)
Cool-Down
For access, consult one of our IM Certified Partners.
Student Lesson Summary
Student Facing
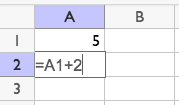
A spreadsheet is very useful for creating new terms in a sequence. For example, for an arithmetic sequence that starts with 5 and has a rate of change of 2, you can type this. "A1" refers to "the contents of cell A1." It's like an address for the cell.

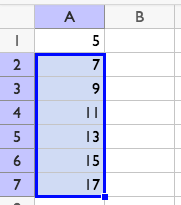
After pressing enter, you can click cell A2 and drag the corner down to show more terms. This move is called fill down.

If you navigate to cell B2 and type =A2-A1, it will say 2. If you fill down from cell B2, all the cells will say 2. This is a way we can tell the sequence is arithmetic, and its rate of change is 2. If, instead in B2 you type =A2/A1, it will say 1.4. If you fill down from cell B2, all of the cells will contain different values. Since the sequence does not have a growth factor, we can tell the sequence is not geometric.
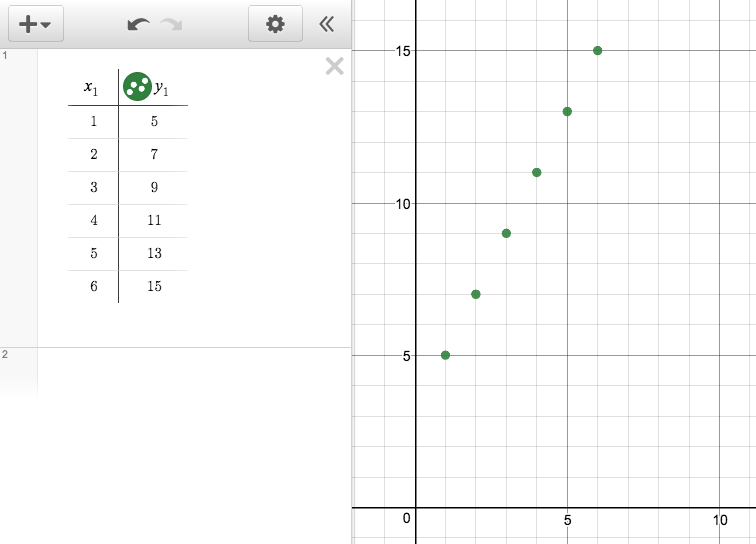
Technology can also be used to plot the terms of a sequence as a function of the term number. The term numbers and term values can be entered in a table and these pairs of numbers are plotted as points in the plane.

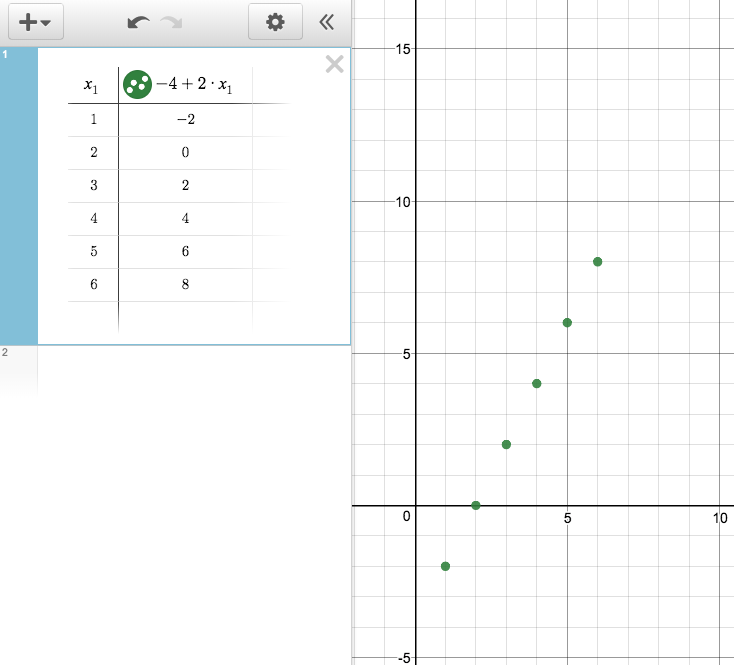
You can also enter a rule for the function in the table header and automatically generate new terms. For example, here is a table and graph representing an arithmetic sequence that starts at -2 for \(x=1\) and has a rate of change of 2:
