Lesson 4
Using Technology to Work with Sequences
Let’s use technology to create a sequence.
4.1: Where Does It Live?
Follow your teacher’s instructions to open a blank spreadsheet.
Type the following in each cell:
In A1, type 2
In A2, type 3
In A3, type -10
In A4, type 1/5
In B1, type =A1+A2
In B2, type =A3*A4
In B3, type =B1+333
In B4, type =abs(B2)
- Look at the numbers that appear in B1, B2, B3, and B4 after you press enter. Where did these numbers come from?
- Experiment with typing some different values in A1, A2, A3, and A4. Describe what happens.
- Experiment with typing some new formulas in some new cells.
- Can you figure out how to raise a number to a power?
- What happens if you forget to start a formula with the = symbol?
4.2: Fill Down
-
Open a blank spreadsheet. In A1, type 10 and enter.
-
In A2, type =A1+3 and enter.
-
Click once on cell A2 to highlight it. See the little + in the lower-right corner? Click and drag it down to highlight several rows in that column and then let go. (This is known as “fill down.”) Describe what happens.
-
What simple thing can you edit so that column A shows the sequence 12, 15, 18, . . .?
-
What simple things can you edit so that column A shows the sequence 12, 11, 10, . . .?
-
-
In B1, type 16 and enter.
-
In B2, type =B1*0.5 and enter.
-
Click on cell B2 and fill down. Describe what happens.
-
What simple thing can you edit so that column B shows the sequence 10, 5, 2.5, . . .?
-
What simple things can you edit so that column B shows the sequence 10, 30, 90, . . .?
-
-
In column C, starting at C1 and going down, type these terms of a geometric sequence: 700, 70, 7, 0.7, 0.07
-
In cell D2, type =C2/C1. What is the result?
-
What is the meaning of the result?
-
Click on cell D2 and fill down. What happens?
-
-
In column E, starting at E1 and going down, type these terms of an arithmetic sequence: 7, 10.5, 14, 17.5
-
In cell F2, type =E2-E1. What is the result?
-
What is the meaning of the result?
-
Click on cell F2 and fill down. What happens?
-
-
Use the spreadsheet to decide whether the sequence 8, 12, 18, 27, 40.5 is arithmetic or geometric, and find its rate of change or growth factor.
-
Use the spreadsheet to decide whether the sequence 50, 42.1, 34.2, 26.3 is arithmetic or geometric, and find its rate of change or growth factor.
Open a blank spreadsheet. In column A, starting in A1 and going down, enter the numbers 0 through 9. What could you type into B1 and then fill down to the 10th row that gives the first 10 terms of a linear function whose rate of change is 2 and vertical intercept is 5?
4.3: Plot Some Points
-
Open a graphing utility and follow your teacher’s instructions to create a new table with 2 columns. Learn how the 2 numbers in each row can be plotted as points in the coordinate plane.
-
Change the numbers in the table so that all of the plotted points lie along a diagonal line with a positive slope.
-
Change the numbers in the table so that all of the plotted points lie along a horizontal line.
-
Change the numbers in the table so that the graph created does not represent a function.
-
-
Follow your teacher’s instructions to make one column a function of the other.
-
Change the expression in the second column so that the plotted points lie on a line with a different steepness.
-
Change the expression in the second column so that the plotted points do not lie on a line.
-
Change the table so that some of the points are plotted in the second quadrant of the graph (the upper-left quadrant).
-
Summary
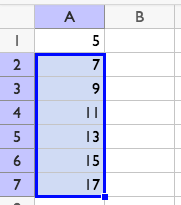
A spreadsheet is very useful for creating new terms in a sequence. For example, for an arithmetic sequence that starts with 5 and has a rate of change of 2, you can type this. "A1" refers to "the contents of cell A1." It's like an address for the cell.

After pressing enter, you can click cell A2 and drag the corner down to show more terms. This move is called fill down.
If you navigate to cell B2 and type =A2-A1, it will say 2. If you fill down from cell B2, all the cells will say 2. This is a way we can tell the sequence is arithmetic, and its rate of change is 2. If, instead in B2 you type =A2/A1, it will say 1.4. If you fill down from cell B2, all of the cells will contain different values. Since the sequence does not have a growth factor, we can tell the sequence is not geometric.
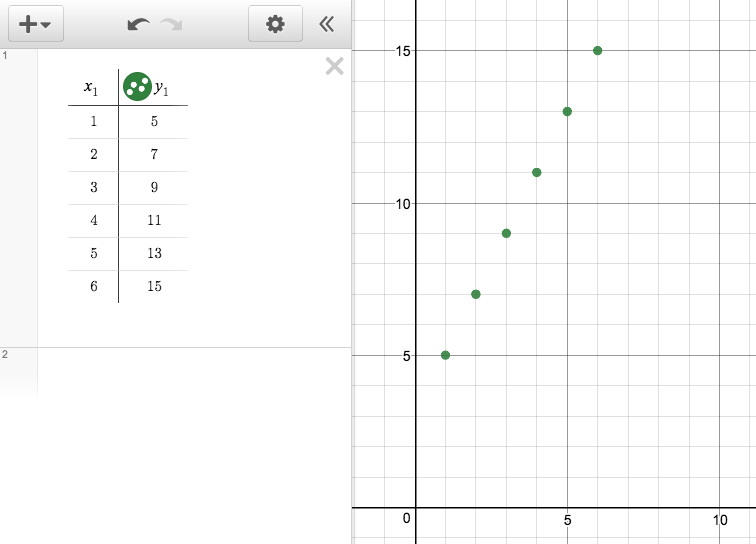
Technology can also be used to plot the terms of a sequence as a function of the term number. The term numbers and term values can be entered in a table and these pairs of numbers are plotted as points in the plane.
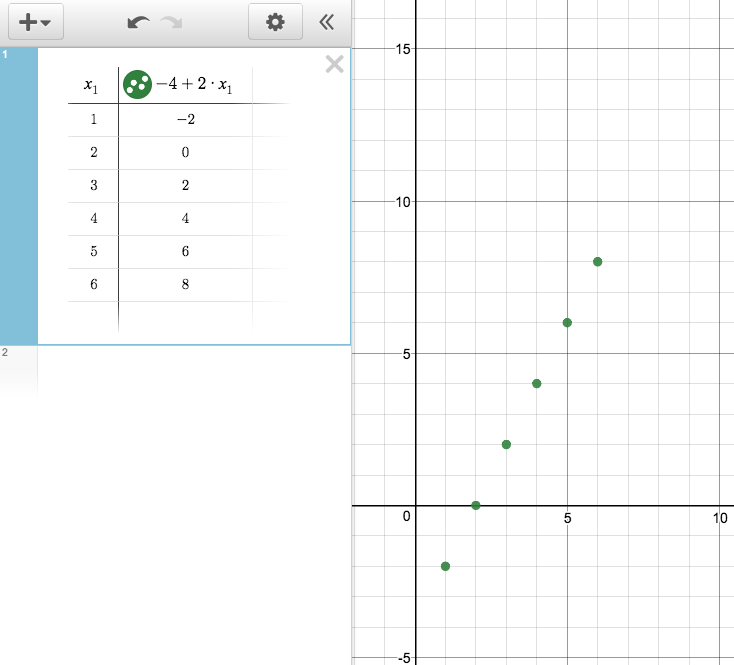
You can also enter a rule for the function in the table header and automatically generate new terms. For example, here is a table and graph representing an arithmetic sequence that starts at -2 for \(x=1\) and has a rate of change of 2:
Glossary Entries
- arithmetic sequence
A sequence in which each term is the previous term plus a constant.
- geometric sequence
A sequence in which each term is a constant times the previous term.