Lesson 16
Graphing from the Vertex Form
16.1: Which Form to Use? (5 minutes)
Warm-up
This warm-up highlights the three forms of quadratic expressions students have seen so far. It reinforces how each form gives different insights into the graph of a quadratic function.
Launch
Arrange students in groups of 2. Give students a minute of quiet think time, and then ask them to share their thinking with a partner.
Student Facing
Expressions in different forms can be used to define the same function. Here are three ways to define a function \(f\).
\(f(x)=x^2-4x+3\)
(standard form)
\(f(x)=(x-3)(x-1)\)
(factored form)
\(f(x)=(x-2)^2-1\)
(vertex form)
Which form would you use if you want to find the following features of the graph of \(f\)? Be prepared to explain your reasoning.
- the \(x\)-intercepts
- the vertex
- the \(y\)-intercept
Student Response
For access, consult one of our IM Certified Partners.
Activity Synthesis
Invite students to share their responses and explanations. Encourage students to name specific features of the graph of \(f\). If time permits, consider asking students to use all of the info they can gather to sketch a graph.
If not already mentioned by students, point out that while the standard form allows us to find the \(y\)-intercept more readily, the \(y\)-intercept can always be found by evaluating the function at \(x=0\).
16.2: Sharing a Vertex (20 minutes)
Activity
In this activity, students graph functions in vertex form and deepen their understanding of the connections between a quadratic expression in this form and the corresponding graph.
Students have previously observed that the graph of a function expressed in the form of \(y=a(x-h)^2 + k\) opens up when \(a\) is positive and opens down when \(a\) is negative. This means that they could sketch a rough graph that goes through a particular vertex and determine the direction of the opening. The work here reinforces and builds on that earlier observation. Students identify two additional points that are on the graph and use them to help sketch a curve. They also reason about whether the vertex represents the minimum or maximum of the function by analyzing the relative values of the coordinate pairs on either side of the vertex.
There are multiple opportunities for students to look for and make use structure (MP7) here.
- Given the coordinates of the vertex and of one other point, they may reason that the graph opens up or down by comparing the \(y\)-values of the two points. For example, if the vertex is \((4,10)\) and one point is \((0,18)\), they may conclude that the vertex must be the minimum of the graph simply because the other known point has a greater \(y\)-value.
- After identifying the coordinates of one point on the graph, students may use the symmetry of the graph of a quadratic function to quickly find the coordinates of a second point.
- When making sense of Priya’s reasoning in the last question, they might notice that in the expression defining \(p\), the \(\text-(x-4)^2\) portion has a value of 0 at the vertex (when \(x\) is 4), because \(\text-(4-4)^2\) is \(0^2\) or 0. For other values of \(x\), \((x-4)^2\) will always be positive because squaring a number always gives a positive result. But because of the negative coefficient, \(\text-(x-4)^2\) will always be negative or less than 0. This means that for all values of \(x\) other than 4, the value of \(p\) would be less than \(p(4)\).
As the focus here is on graphing a function by identifying points on the graph and by using structure, technology is not an appropriate tool.
Launch
Display the two equations defining \(p\) and \(q\) for all to see. Give students a moment to think about how the equations are alike and how they are different. Invite students to share their comments.
If not mentioned by students, ask: “Where are the vertices of their graphs located?” (All of the equations have an \((x-4)^2\) in them and a 10 constant term. This means that the vertex for each graph is at the same location, at \((4,10)\).)
Remind students that, earlier in the unit, we learned that the vertex of a graph represents the maximum or the minimum value of a function. Ask students:
- "How can we tell if the vertex of the graph of \(p\) represents the maximum or the minimum?" (If the graph opens upward, the vertex is the minimum. If it opens downward, it is the maximum.)
- "How can we tell if the graph of \(p\) opens upward or downward?" (In an earlier lesson, we saw that when a quadratic function is expressed in the form of \(y=a(x-h)^2+k\) and the coefficient \(a\) is negative, the graph opens downward. This means the vertex represents the maximum of the function. Or we could plot some coordinate pairs to help us visualize the graph.)
If no students mentioned finding additional points on each graph to determine whether the graph opens up or down, ask them about it.
Because this activity is designed to be completed without technology, ask students to put away any devices.
Design Principle(s): Support sense-making; Optimize output (for explanation)
Supports accessibility for: Memory; Conceptual processing
Student Facing
Here are two equations that define quadratic functions.
\(\displaystyle p(x) =\text-(x-4)^2 + 10\\ q(x) = \frac12(x-4)^2 + 10\)
-
The graph of \(p\) passes through \((0,\text-6)\) and \((4,10)\), as shown on the coordinate plane.
Find the coordinates of another point on the graph of \(p\). Explain or show your reasoning. Then, use the points to sketch and label the graph.

- On the same coordinate plane, identify the vertex and two other points that are on the graph of \(q\). Explain or show your reasoning. Sketch and label the graph of \(q\).
-
Priya says, "Once I know the vertex is \((4,10)\), I can find out, without graphing, whether the vertex is the maximum or the minimum of function \(p\). I would just compare the coordinates of the vertex with the coordinates of a point on either side of it."
Complete the table and then explain how Priya might have reasoned about whether the vertex is the minimum or maximum.
\(x\) 3 4 5 \(p(x)\) 10
Student Response
For access, consult one of our IM Certified Partners.
Student Facing
Are you ready for more?
- Write a the equation for a quadratic function whose graph has the vertex at \((2,3)\) and contains the point \((0,\text-5)\).
- Sketch a graph of your function.
Student Response
For access, consult one of our IM Certified Partners.
Anticipated Misconceptions
Students may be unsure about what input value to choose to find additional points on each graph. Without telling students a specific value to use, encourage them to choose an \(x\)-value that is simple to evaluate and would help them sketch the graph.
Activity Synthesis
Invite students to share their graphs and how they went about finding the coordinates of one other point on the graph of \(p\) and two other points on the graph of \(q\). Highlight explanations that make use of the symmetry of the graph to identify an additional point on the graph once one point (aside from the vertex) is known.
Then, select students to explain their analysis of Priya’s reasoning. Make sure students see that the vertex of the graph of \(p\) cannot be the minimum value of the function (and thus cannot have an upward-opening graph) because there are other values of \(p\) that are less than 10. If the vertex was the minimum, no other values of \(p\) would be less than at \(p(4)\).
Likewise, once we see that \((0,\text-6)\) is on the graph of \(p\) and its \(y\)-value is less than that of the vertex, we can reason that the vertex \((4,10)\) represents the maximum of the function and the graph would open downward.
Consider showing a table such as these to clarify the input-output relationship in each function.
Function \(p\)
| \(x\) | 0 | 1 | 2 | 3 | 4 | 5 | 6 |
|---|---|---|---|---|---|---|---|
| \(\text-(x-4)^2+10\) | -6 | 1 | 6 | 9 | 10 | 9 | 6 |
Function \(q\)
| \(x\) | 0 | 1 | 2 | 3 | 4 | 5 | 6 |
|---|---|---|---|---|---|---|---|
| \(\frac12(x-4)^2+10\) | 18 | \(14\frac12\) | 12 | \(10\frac12\) | 10 | \(10\frac12\) | 12 |
If time permits, discuss with students how we can also determine whether the vertex is the maximum or minimum by studying the structure of squared term in the vertex form. Let’s take function \(q\) as an example. Ask students:
- “In the expression defining \(q\), what is the value of \((x-4)^2\) when \(x\) is 4?” (0)
- “What is the value of \((x-4)^2\) when \(x\) is less than 4, say, when it is 1? Is it greater or less than 0?” (At \(x=1\), \((x-4)^2\)is 9, which is greater than 0.)
- “What about when \(x\) is greater than 4, say, when it is 5?” (At \(x=5\), \((x-4)^2\) is 1, which is also greater than 0.)
- “If the squared term \((x-4)^2\) is 0 when \(x\) is 4, and greater than 0 when \(x\) is any other number, does \(x=4\) give the minimum or the maximum point on the graph?” (the minimum)
- “Does multiplying \((x-4)^2\) by \(\frac12\) change the fact that the minimum is at \(x=4\)? Why or why not?” (No. Multiplying \((x-4)^2\) by \(\frac12\) halves all the values but they will still be positive or greater than 0. 0 times \(\frac12\) is still 0.)
- “What about adding 10 to \((x-4)^2\)?” (No. Adding 10 increases the value of \((x-4)^2\) by 10, regardless of the input.)
16.3: Card Sort: Matching Equations with Graphs (10 minutes)
Activity
In this activity, students are given a set of equations and graphs of quadratic functions and are asked to match them. To do so, students apply their understanding about the connections between the two representations. To make the matches, they are to rely on the structure of a quadratic expression and how it relates to the graph, so technology is not an appropriate tool here.
As students work, encourage them to refine their descriptions of the equations and graphs using more precise language and mathematical terms (MP6). They also practice explaining their reasoning and critiquing the reasoning of others (MP3) as they take turns matching and supporting their matches.
As students discuss, listen for strategies they use to match the representations. Highlight productive and reliable strategies as well as use of precise language in the discussion.
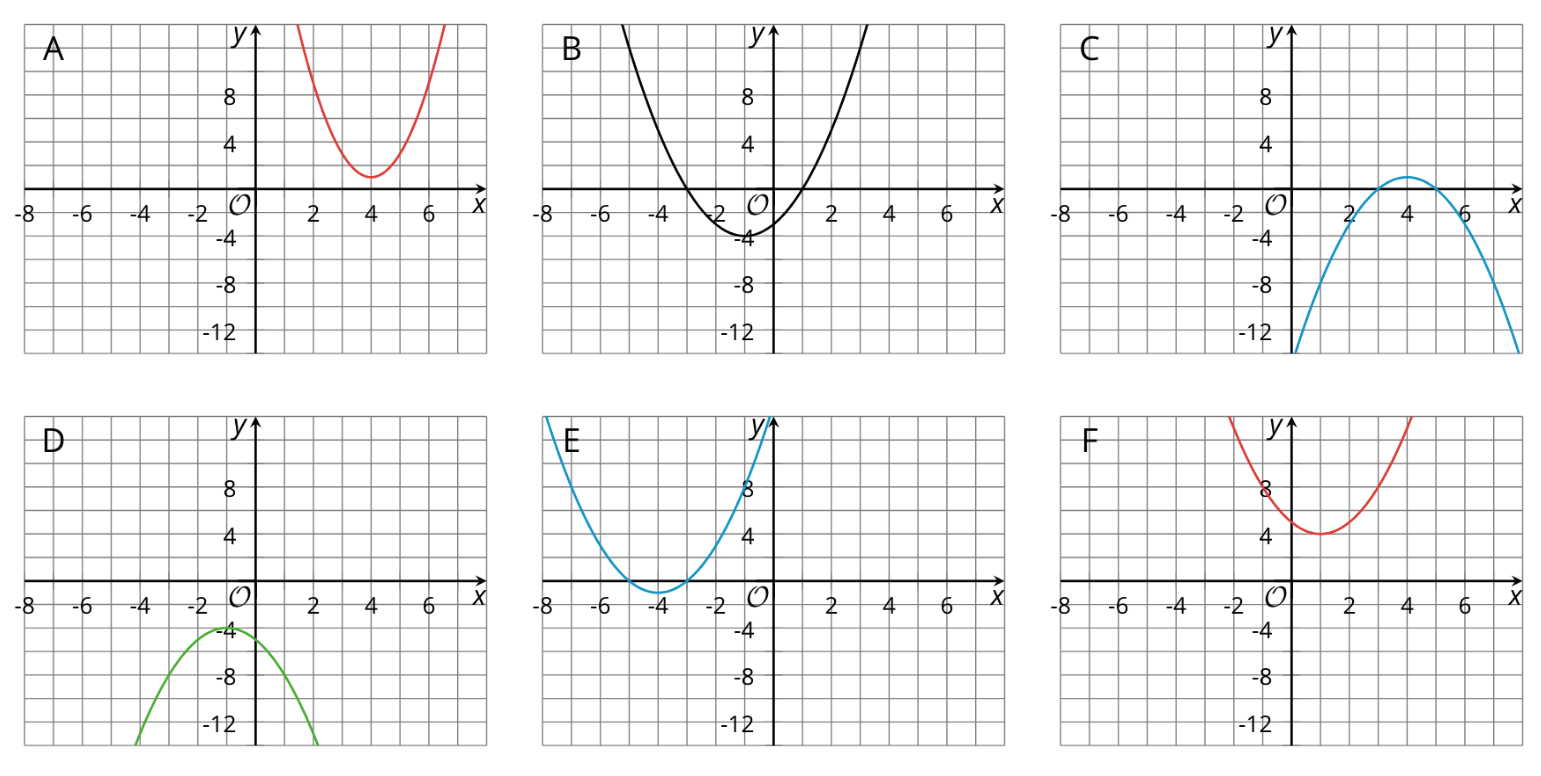
Here are the equations and graphs for reference and planning:
\(f(x)=(x-1)^2 + 4\)
\(g(x)=\text-(x-4)^2 + 1\)
\(h(x)=(x+1)^2 - 4\)
\(p(x)= \text-(x+1)^2 - 4\)
\(q(x)=2(x-4)^2 +1\)
\(r(x)=(x+4)^2 -1\)
Launch
Arrange students in groups of 2. Give each group a set of cut-up cards. Ask students to take turns matching a card containing an equation with a graph that represents it. The first partner identifies a match and explains why they think it is a match, while the other listens and works to understand. Then, they switch roles. If they disagree, they should discuss their thinking and work to reach an agreement. Ask students to record each match (write the equation and sketch the graph) and their reasoning. If time is limited, students may just record the label of the graph instead of sketching.
Because this activity is designed to be completed without technology, ask students to put away any devices.
Design Principle(s): Support sense-making; Cultivate conversation
Supports accessibility for: Conceptual processing; Organization
Student Facing
Your teacher will give you a set of cards. Each card contains an equation or a graph that represents a quadratic function. Take turns matching each equation to a graph that represents the same function.
- For each pair of cards that you match, explain to your partner how you know they belong together.
- For each pair of cards that your partner matches, listen carefully to their explanation. If you disagree, discuss your thinking and work to reach an agreement.
- Once all the cards are matched, record the equation, the label and a sketch of the corresponding graph, and write a brief note or explanation about how you knew they were a match.
Equation:

Explanation:
Equation:
Explanation:
Equation:
Explanation:
Equation:
Explanation:
Equation:
Explanation:
Equation:
Explanation:
Student Response
For access, consult one of our IM Certified Partners.
Anticipated Misconceptions
Some students may be challenged to identify the coordinates of the vertex on the graphs because the \(x\)- and \(y\)-axes use a different scale. Encourage students to write down coordinates of the vertex and the intercepts to help them match the graphs to the equations. Some students may have trouble identifying that one graph is steeper than the others. Provide them with a piece of patty-paper or a transparency and have them trace one graph onto it. They can overlay the traced graph on top of the other graphs to figure out which one is steeper. Students used similar tools to explore transformations in middle school.
Activity Synthesis
Invite students to share aspects of the equations and graphs they found helpful for the matching. If not mentioned in students’ explanations, highlight the following features:
-
The number being added or subtracted from \(x\) in the squared term, or the \(h\) in \((x-h)^2\):
- If \(h\) is being subtracted from \(x\), \(h\) is a positive number and the \(x\)-coordinate of the vertex is positive.
- If \(h\) is being added to \(x\) in the expression, then \(h\) is a negative number and the \(x\)-coordinate of the vertex is negative.
-
The constant term in the quadratic expression in vertex form, or the \(k\) in \(a(x-h)^2+k\):
- If \(k\) is positive, the \(y\)-coordinate of the vertex is also positive.
- If \(k\) is negative, the \(y\)-coordinate of the vertex is also negative.
-
The coefficient of the squared term, or the \(a\) in \(a(x-h)^2+k\): We saw earlier that when the squared term has a negative coefficient, it makes all positive values negative. This means that:
- If \(a\) is negative, the vertex represents the maximum (the graph of the quadratic function opens downward).
- If \(a\) is positive, the vertex represents the minimum (the graph of the quadratic function opens upward).
-
The magnitude of \(a\):
- The larger \(|a|\) is, the narrower the opening of the graph is (or the “steeper” the graph is).
Students may also reason the other way around: by looking at the graphs first and then relate the features of the graphs to the equations.
Lesson Synthesis
Lesson Synthesis
To help students consolidate and articulate the ideas from this lesson, ask questions such as:
- “Suppose we graph the equation \(y=\text-2(x-7)^2+5\). What is the vertex of the graph?” \((\text7,5)\)
- “What are some ways to tell if the vertex is the maximum or the minimum point on the graph?” (Some explanations:
- The squared term \((x-7)^2\) has a negative coefficient. We saw earlier that when that coefficient is negative the graph opens down, so the vertex is the maximum point.
- When \(x=7\), the \(y\) value is 5. When \(x\) is greater than 7, \(y\) is less than 5. When \(x\) is less than 7, \(y\) is also less than 5. This means that the points on either side of the vertex have smaller \(y\)-values, so the vertex is the maximum.
- When \(x\) is 7, \((x-7)^2\) is 0. Multiplying it by -2 gives 0. When \(x\) is other than 7, \((x-7)^2\) is a positive number. Multiplying it by -2 gives a negative number, so it is less than 0.)
- “How can we verify that 5 is the \(y\)-coordinate of the vertex?” (Evaluate the function at \(x=7\) gives \(\text-2(7-7)^2+5 = 0 +5 = 5\).)
- “Does knowing the location of the vertex and whether the graph opens up or down enough for sketching the graph to represent \(y=\text-2(x-7)^2+5\)? If not, what else is needed?” (We still don’t know how “wide” or “narrow” the opening of the graph will be, so it helps to know another point on the graph. To find another point, we can choose an \(x\)-value and find the corresponding
\(y\)-value. We can use that point to quickly find one more point with the same \(y\)-coordinate because the graph is symmetric across the vertex.)
16.4: Cool-down - Sketching A Graph (5 minutes)
Cool-Down
For access, consult one of our IM Certified Partners.
Student Lesson Summary
Student Facing
We saw that vertex form is especially helpful for finding the vertex of a graph of a quadratic function. For example, we can tell that the function \(p\) given by \(p(x) = (x-3)^2 + 1\) has a vertex at \((3,1)\).
We also noticed that, when the squared expression \((x-3)^2\) has a positive coefficient, the graph opens upward. This means that the vertex \((3,1)\) represents the minimum function value.

But why does the function \(p\) take on its minimum value when \(x\) is 3?
Here is one way to explain it: When \(x=3\), the squared term \((x-3)^2\) equals 0, as \((3-3)^2 =0^2=0\). When \(x\) is any other value besides 3, the squared term \((x-3)^2\) is a positive number greater than 0. (Squaring any number results in a positive number.) This means that the output when \(x \neq 3\) will always be greater than the output when \(x=3\), so the function \(p\) has a minimum value at \(x=3\).
This table shows some values of the function for some values of \(x\). Notice that the output is the least when \(x=3\) and it increases both as \(x\) increases and as it decreases.
| \(x\) | 0 | 1 | 2 | 3 | 4 | 5 | 6 |
|---|---|---|---|---|---|---|---|
| \((x-3)^2+1\) | 10 | 5 | 2 | 1 | 2 | 5 | 10 |
The squared term sometimes has a negative coefficient, for instance: \(h(x)= \text-2(x+4)^2\). The \(x\) value that makes \((x+4)^2\) equal 0 is -4, because \((\text-4+4)^2=0^2=0\). Any other \(x\) value makes \((x+4)^2\) greater than 0. But when \((x+4)^2\) is multiplied by a negative number (-2), the resulting expression, \(\text-2(x+4)^2\), ends up being negative. This means that the output when \(x \neq \text-4\) will always be less than the output when \(x=\text-4\), so the function \(h\) has its maximum value when \(x =\text-4\).

Remember that we can find the \(y\)-intercept of the graph representing any function we have seen. The \(y\)-coordinate of the \(y\)-intercept is the value of the function when \(x = 0\). If \(g\) is defined by \(g(x)=(x+1)^2-5\), then the \(y\)-intercept is \((0,\text-4)\) because \(g(0)=(0+1)^2 -5=\text-4\). Its vertex is at \((\text-1,\text-5)\). Another point on the graph with the same \(y\)-coordinate is located the same horizontal distance from the vertex but on the other side.
