Lesson 1
Two-way Tables
1.1: Utensils and Paper Preferences (10 minutes)
Warm-up
The purpose of this activity is not to construct a perfect two-way table, but to motivate the need for an efficient representation. Monitor for students who:
- go back to the original statements to answer each question from scratch
- draw shapes to represent the students and group them into utensil and paper preferences
- create a table to keep track of the information, complete the table, and then answer the questions
Launch
Allow students 3 to 5 minutes to work the questions then have a whole group discussion.
Student Facing
Several students are surveyed about whether they prefer writing with a pen or a pencil and they are also asked whether they prefer lined paper or unlined paper. Some of the results are:
- The survey included 100 different students.
- 40 students said they prefer using pen more than pencil.
- 45 students said they prefer using unlined paper more than lined paper.
- 10 students said they prefer lined paper and pen.
- 45 students said they prefer pencil and lined paper.
For each part, explain or show your reasoning.
- How many students prefer using pencil more than pen?
- How many students prefer using pen and unlined paper?
- How many students prefer using pencil and unlined paper?
Student Response
For access, consult one of our IM Certified Partners.
Activity Synthesis
The purpose of this discussion is for students to share the different ways they approached this problem and to introduce how to represent data using a two-way table.
Select previously identified students who used different solving methods in the order:
- answering the question from scratch
- drawing shapes for groupings
- creating a table
Point out that a categorical variable represents data which can be divided into groups or categories. In this example, utensil and paper preference are two categorical variables.
If no students used a table to organize the information and answer the questions, demonstrate how to solve the questions by creating and completing a two-way table.
| prefer pen | prefer pencil | total | |
|---|---|---|---|
| prefer lined paper | 10 | 45 | 55 |
| prefer unlined paper | 30 | 15 | 45 |
| total | 40 | 60 | 100 |
Ask students:
- “Why is this table an effective method for solving this question?” (It is effective because it keeps track of all the information we know and don’t know in a way that is organized to show the relationship between each piece of information.)
- “Was using a table the only way to solve the questions?” (No, there are other methods to arrive at a good solution. Reasoning from the original statements, drawing a representation of the situation, or other similar methods are also good ways to approach the problem.)
- “What does the word ‘two’ in two-way table refer to? How is it seen in the example from the task?” (The number of categorical variables, not the number of categories for each variable. In this example, the two variables are writing utensil preference and paper preference.)
Summarize by stating: “A two-way table can be used to organize data from two different categorical variables.”
1.2: Fruit Fly Mutations (10 minutes)
Activity
The mathematical purpose of this activity is for students to interpret data in a two-way table. Students answer questions such as the meaning of particular values or totals for a group using information in a two-way table.
Launch
Arrange students in groups of 2. After quiet work time, ask students to compare their responses to their partner’s and justify their reasoning for any differences in the responses.
Supports accessibility for: Language; Organization
Student Facing
A scientist is trying to determine the role of specific genes by looking at traits of fruit flies. The offspring of two fruit flies are examined to determine the color of their eyes and whether they have curled wings or standard wings. Eighty offspring are randomly selected, and the results are recorded in the two-way table.
| curled wings | standard wings | |
|---|---|---|
| red eyes | 17 | 45 |
| white eyes | 5 | 13 |
- Describe what the 17 in the table represents.
- How many selected fly offspring had white eyes? Explain or show your reasoning.
- How many selected fly offspring had standard wings? Explain or show your reasoning.
Student Response
For access, consult one of our IM Certified Partners.
Student Facing
Are you ready for more?
-
Write 2 of your own survey questions that produce data which can be represented in a two-way table.
-
Give the survey to 20 or more students and record the results in a two-way table.
-
What questions can you answer with the information you found from your survey?
-
What does that tell you about the population of students who took your survey?
Student Response
For access, consult one of our IM Certified Partners.
Anticipated Misconceptions
When asked about a category, students may not include both columns or rows in the total. Ask students to describe what each number in the table represents and which ones might apply to flies with white eyes.
Activity Synthesis
The goal is to make sure students understand how to interpret information in a two-way table. Here are some questions for discussion.
- “What does the 13 in the table represent?” (The number of offspring with white eyes and standard wings.)
- “How many selected fruit fly offspring have red eyes and standard wings?” (45)
- “How many selected fruit fly offspring are represented in the table?” (80)
- “How many selected fruit fly offspring have curled wings?” (22)
Restate, “A two-way table can be used to organize data from two different categorical variables.”
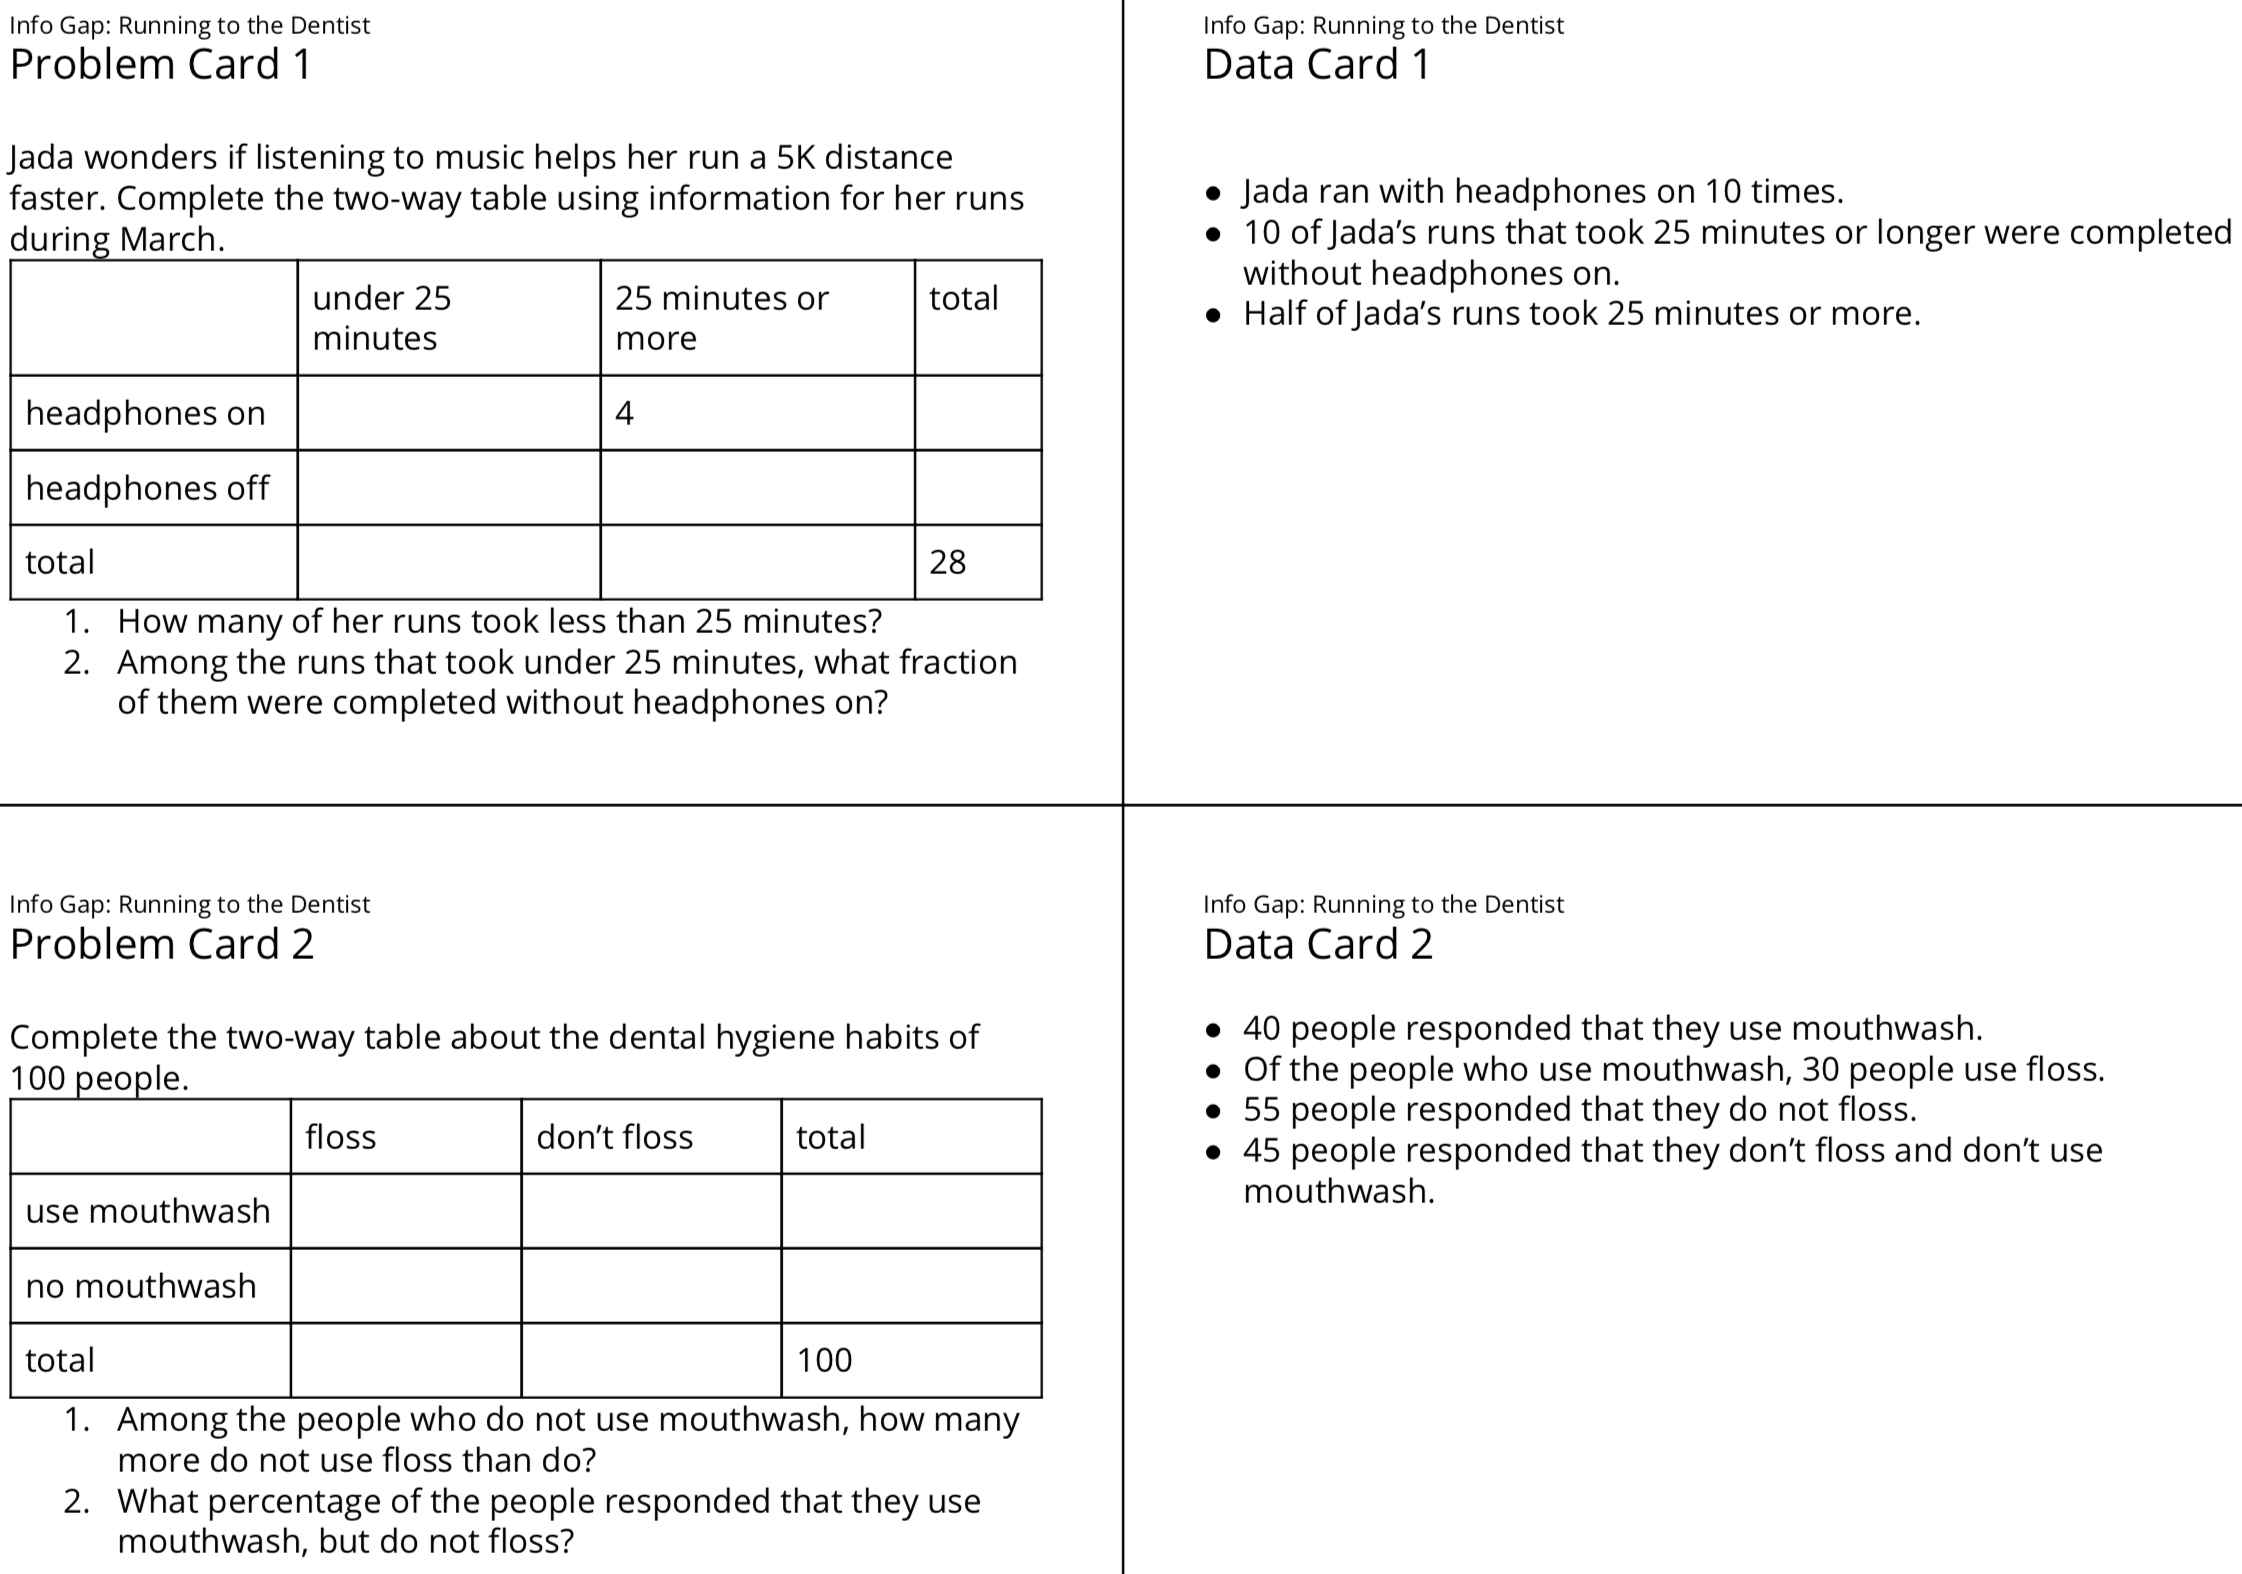
1.3: Info Gap: Running to the Dentist (10 minutes)
Activity
This Info Gap activity gives students an opportunity to determine and request the information needed to understand the relationships among cells in a two-way table.
The Info Gap structure requires students to make sense of problems by determining what information is necessary, and then to ask for information they need to solve it. This may take several rounds of discussion if their first requests do not yield the information they need (MP1). It also allows them to refine the language they use and ask increasingly more precise questions until they get the information they need (MP6).
Here is the text of the cards for reference and planning:
Launch
Keep students in their groups of two. Give students 5 minutes to fill in the two-way tables then have a whole class discussion.
Design Principle(s): Cultivate Conversation
Supports accessibility for: Memory; Organization
Student Facing
Your teacher will give you either a problem card or a data card. Do not show or read your card to your partner.
If your teacher gives you the data card:
- Silently read the information on your card.
- Ask your partner “What specific information do you need?” and wait for your partner to ask for information. Only give information that is on your card. (Do not figure out anything for your partner!)
- Before telling your partner the information, ask “Why do you need to know (that piece of information)?”
- Read the problem card, and solve the problem independently.
- Share the data card, and discuss your reasoning.
If your teacher gives you the problem card:
- Silently read your card and think about what information you need to answer the question.
- Ask your partner for the specific information that you need.
- Explain to your partner how you are using the information to solve the problem.
- When you have enough information, share the problem card with your partner, and solve the problem independently.
- Read the data card, and discuss your reasoning.
Pause here so your teacher can review your work. Ask your teacher for a new set of cards and repeat the activity, trading roles with your partner.
Student Response
For access, consult one of our IM Certified Partners.
Activity Synthesis
After students have completed their work, share the correct answers and ask students to discuss the process of solving the problems. Here are some questions for discussion:
- “What strategy did you use to find additional values that were not provided on the data card?” (If I knew the row total, I knew the sum of the two values in the same row, so I could subtract one of the values from the total to get the other.)
- “How do the totals along the bottom of the table differ from the totals along the right side of the table?” (Along the bottom, the totals are the sum of the values in the column describing—for example, how many people reported that they floss. Along the right side of the table, the totals represent the sum of the values in each row—for example, how many people reported that they use mouthwash.)
- “How can you describe the value of 8 in the first problem?” (The times Jada ran with headphones off and took under 25 minutes to finish.)
Highlight for students the meaning of the values in the cells and various ways to describe the intersection of two categories.
Lesson Synthesis
Lesson Synthesis
Discuss how to create and interpret two-way tables.
- “What does the two-way in two-way tables mean?” (It means there are two different categorical variables being examined. For example, whether people floss or not, and whether people use mouthwash or not.)
- “What does each value represent in a two-way table? Use an example if needed.” (Each value represents the frequency of a combination of categories occurring. For example, 17 fruit fly offspring had red eyes and curled wings. Each value represents data from two different questions.)
- “Have you used two-way tables previously?” (Yes, we used them in science class when doing Punnett squares.)
1.4: Cool-down - Oh, Deer (5 minutes)
Cool-Down
For access, consult one of our IM Certified Partners.
Student Lesson Summary
Student Facing
In statistics, a variable is a characteristic that can take on different values. A categorical variable is a variable that takes on values which can be divided into groups or categories. Data from two categorical variables about a single subject can be organized using a two-way table.
For example, this two-way table shows the results from 170 responses to a survey asking people their age group and whether they have a cell phone or not.
| has a cell phone | does not have a cell phone | |
|---|---|---|
| 10–12 years old | 25 | 35 |
| 13–15 years old | 38 | 12 |
| 16–18 years old | 52 | 8 |
The 38 in the table means that 38 of the 170 people surveyed are in both the 13–15 years old age category and have a cell phone. The two-way table also shows that 55 of the people surveyed do not have cell phones, since \(35+12+8 = 55\).
The categories for a single variable should not overlap (a person cannot be 10–12 years old and 13–15 years old at the same time); each individual is included in only one of the cells in the table rather than in multiple places.