Lesson 10
Fossils and Flags
- Let’s collect some data and analyze it.
10.1: A Fossil Puzzle

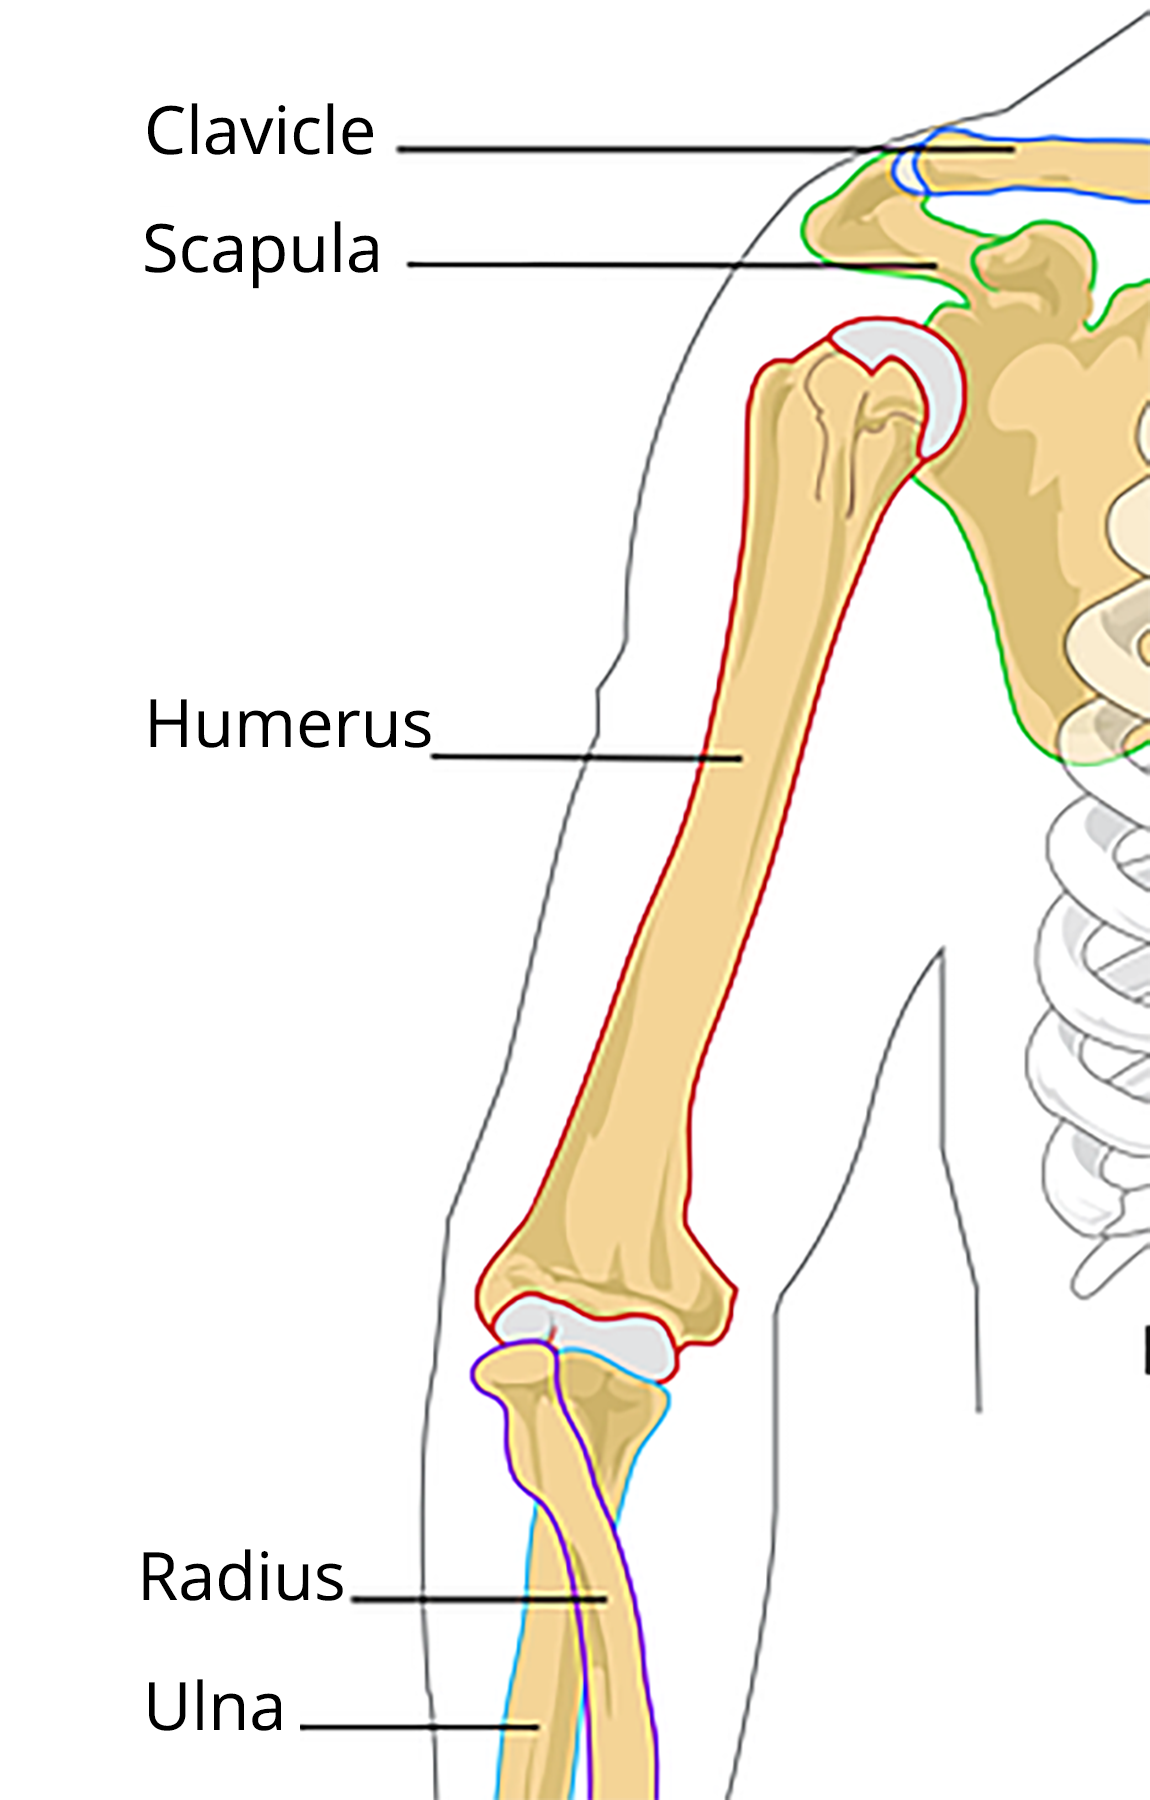
An anthropologist finds a fossilized humerus bone of an ancient human ancestor. The humerus is an arm bone running from the shoulder to the elbow. It is 24 centimeters in length. Use data from your classmates to estimate the height of this ancient human.
10.2: Playing Dirty
- Before researching data, do you think the number of penalties a team gets in a season is correlated to the number of wins the team gets in that season? Do you think it is a positive or negative relationship? Do you think the relationship is weak or strong? Explain your reasoning.
- Is there a relationship between the number of penalties a team gets in a season and the number of wins in that season? Show any mathematical work that leads to your answer.
- Do penalties cause a change in wins or wins cause a change in penalties or neither? Explain your reasoning.
Summary
Scatter plots can be useful to display possible relationships between two variables. Once a pattern is recognized, fitting a function to the data and then recognizing how well the function represents the relationship in the data can quantify your intuition about relationships between variables. The best fit line, for example, can be used to predict the value of one variable based on the value of a second variable. Although technology can aid in finding best fit lines and evaluating the strength of the line’s fit, human understanding of the variables and of how the data were collected is still required to determine whether the relationship is merely a relationship or whether there is a causal relationship.