Lesson 5
Equations and Their Graphs
- Let’s graph equations in two variables.
5.1: Which One Doesn't Belong: Hours and Dollars
Which one doesn’t belong?
A

B

C

D

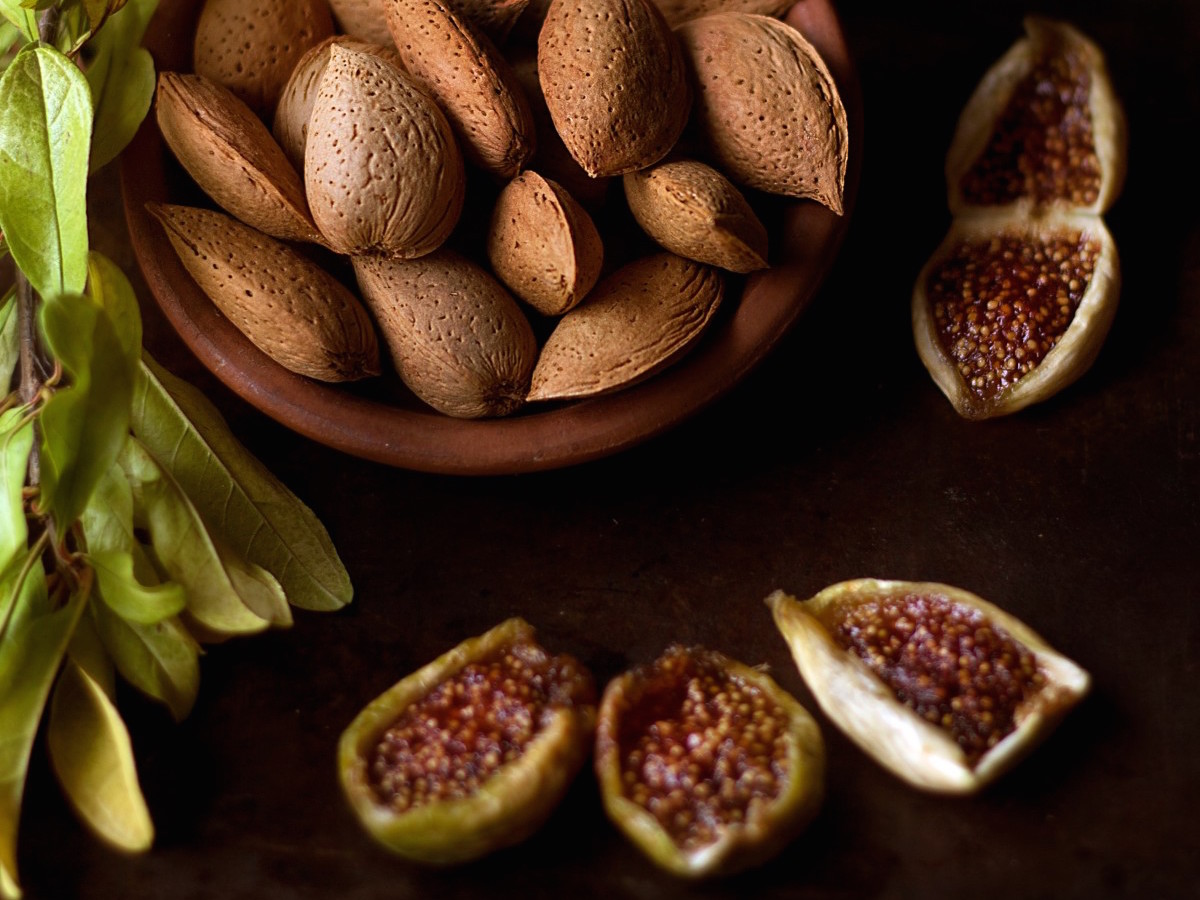
5.2: Snacks in Bulk
To get snacks for a class trip, Clare went to the “bulk” section of the grocery store, where she could buy any quantity of a product and the prices are usually good.
Clare purchased some salted almonds at $6 a pound and some dried figs at $9 per pound. She spent $75 before tax.
- If she bought 2 pounds of almonds, how many pounds of figs did she buy?
- If she bought 1 pound of figs, how many pounds of almonds did she buy?
- Write an equation that describes the relationship between pounds of figs and pounds of almonds that Clare bought, and the dollar amount that she paid. Be sure to specify what the variables represent.
- Here is a graph that represents the quantities in this situation.

- Choose any point on the line, state its coordinates, and explain what it tells us.
- Choose any point that is not on the line, state its coordinates, and explain what it tells us.
5.3: Graph It!
- A student has a savings account with \$475 in it. She deposits \$125 of her paycheck into the account every week. Her goal is to save \$7,000 for college.
- How much will be in the account after 3 weeks?
- How long will it take before she has \$1,350?
- Write an equation that represents the relationship between the dollar amount in her account and the number of weeks since she started depositing \$125 each week.
- Graph your equation using graphing technology. Mark the points on the graph that represent the amount after 3 weeks, and also the week she has \$1,350. Write down the coordinates.
- How long will it take her to reach her goal?
- A 450-gallon tank full of water is draining at a rate of 20 gallons per minute.
- How many gallons will be in the tank after 7 minutes?
- How long will it take for the tank to have 200 gallons?
- Write an equation that represents the relationship between the gallons of water in the tank and minutes the tank has been draining.
- Graph your equation using graphing technology. Mark the points on the graph that represent the gallons after 7 minutes and the time when the tank has 200 gallons. Write down the coordinates.
- How long will it take until the tank is empty?
- Write an equation that represents the relationship between the gallons of water in the tank and hours the tank has been draining.
- Write an equation that represents the relationship between the gallons of water in the tank and seconds the tank has been draining.
- Graph each of your new equations. In what way are all of the graphs the same? In what way are they all different?
- How would these graphs change if we used quarts of water instead of gallons? What would stay the same?
Summary
Like an equation, a graph can give us information about the relationship between quantities and the constraints on them.
Suppose we are buying beans and rice to feed a large gathering of people, and we plan to spend \$120 on the two ingredients. Beans cost \$2 a pound and rice costs \$0.50 a pound.
If \(x\) represents pounds of beans and \(y\) pounds of rice, the equation \(2x + 0.50y = 120\) can represent the constraints in this situation.
The graph of \(2x + 0.50y = 120\) shows a straight line.

Each point on the line is a pair of \(x\)- and \(y\)-values that make the equation true and is thus a solution. It is also a pair of values that satisfy the constraints in the situation.
- The point \((10,200)\) is on the line. If we buy 10 pounds of beans and 200 pounds of rice, the cost will be \(2(10) + 0.50(200)\), which equals 120.
- The points \((60,0)\) and \((45,60)\) are also on the line. If we buy only beans—60 pounds of them—and no rice, we will spend \$120. If we buy 45 pounds of beans and 60 pounds of rice, we will also spend \$120.
What about points that are not on the line? They are not solutions because they don't satisfy the constraints, but they still have meaning in the situation.
- The point \((20, 80)\) is not on the line. Buying 20 pounds of beans and 80 pounds of rice costs \(2(20) + 0.50(80)\) or 80, which does not equal 120. This combination costs less than what we intend to spend.
- The point \((70,180)\) means that we buy 70 pounds of beans and 180 pounds of rice. It will cost \(2(70)+0.50(180)\) or 230, which is over our budget of 120.
Glossary Entries
- constraint
A limitation on the possible values of variables in a model, often expressed by an equation or inequality or by specifying that the value must be an integer. For example, distance above the ground \(d\), in meters, might be constrained to be non-negative, expressed by \(d \ge 0\).
- model
A mathematical or statistical representation of a problem from science, technology, engineering, work, or everyday life, used to solve problems and make decisions.