Lesson 8
Interpret Picture Graphs
Warm-up: How Many Do You See: Dots within 10 (10 minutes)
Narrative
The purpose of this warm-up is for students use grouping strategies to describe the images they see. This is the students' first experience with the “How Many Do You See” routine in grade 2. They may use their knowledge of addition facts or mental strategies to determine the total number of dots. When students notice and use the structure of 5 dots to describe how they see the images, they look for and make use of structure (MP7).
Launch
- Groups of 2
- "How many do you see? How do you see them?"
- Flash image.
- 30 seconds: quiet think time
Activity
- Display image.
- "Discuss your thinking with your partner."
- 1 minute: partner discussion
- Record responses.
- Repeat for each image.
Student Facing
How many do you see? How do you see them?


Student Response
For access, consult one of our IM Certified Partners.
Activity Synthesis
- “How did your method stay the same or change in each image?” (For the first image I counted on 5, 6, 7. For the second image I knew \(5 + 5 = 10\). For the last image I took 1 away from 10.)
- Make connections between the visual representations and the equations that could represent them when recording their responses.
Activity 1: Veggies People Love (20 minutes)
Narrative
The purpose of this activity is for students to learn a new way of organizing data: a picture graph. In the launch, students engage in a discussion about what they notice about the graph and how a picture graph makes it easier to interpret data. After students discuss the picture graph and consider what they could learn from the graph, wrap up with the following question: “What is the total number of kids who love spinach or corn?” This question uses “or” to signify the sum of the two categories. This phrasing may be new for students.
Advances: Speaking, Conversing
Launch
- Groups of 2
- Display “Veggies Kids Love” graph, but cover the title.
- “Clare made this picture graph to share data she collected.”
- “What could this graph represent?”
- 30 seconds: quiet think time
- Share responses.
- “Clare asked the kids in her class which vegetable they loved.”
- “She made a picture graph to show their responses.”
- “A picture graph is a way to show how many in each group or category using pictures of the objects or symbols.”
- “What can you learn about the veggies kids love from her picture graph?” (The veggie with the most votes is carrots. Not a lot of kids like spinach.)
- 1 minute: quiet think time
- 2 minutes: partner discussion
- Record student responses with complete sentences.
- “What is the total number of kids who love spinach or corn?” (6 kids. Two like spinach and 4 like corn.)
- 30 seconds: quiet think time
- Share responses
Activity
- “Now you can answer a few questions based on a picture graph showing data about the vegetables the adults at school love.”
- 6 minutes: independent work time
- “Share the fact you wrote for the third question with a partner.”
- 3 minutes: partner discussion
Student Facing
Clare asked a group of kids, “What veggies do you love?” Their responses are shown in this picture graph.
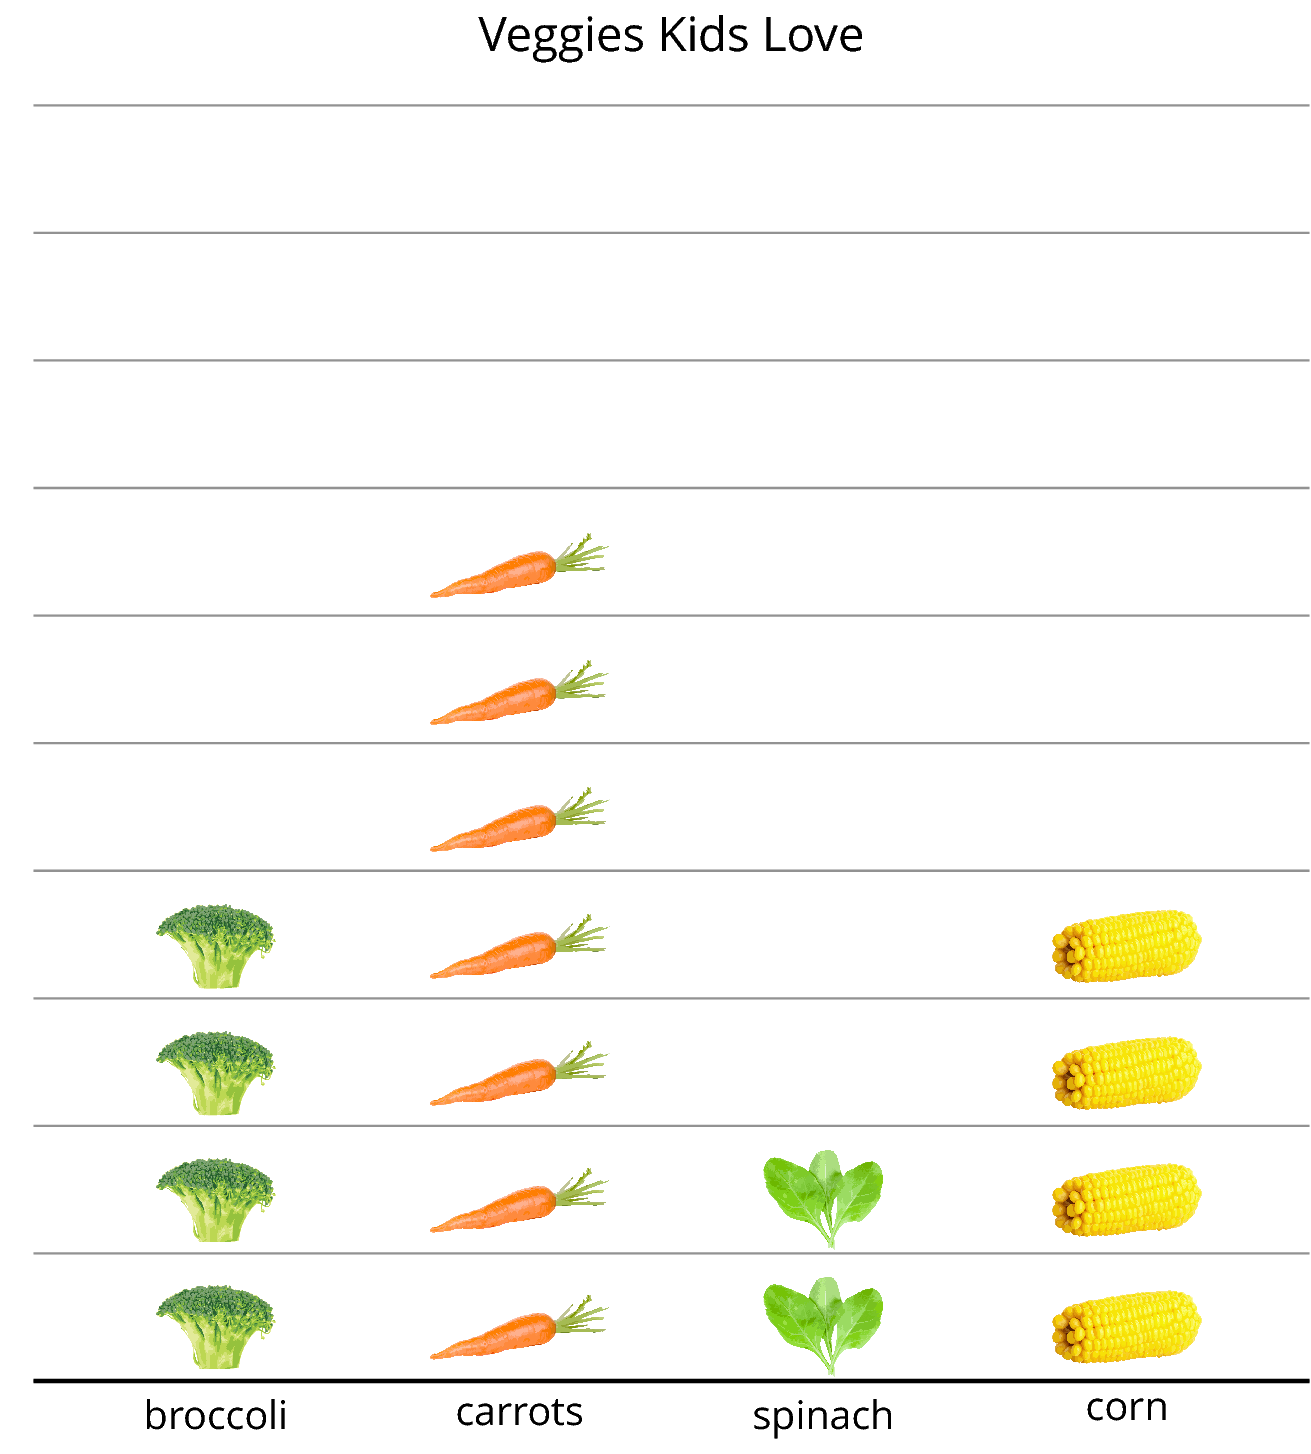
What can you learn about the veggies kids love from Clare’s picture graph?
A group of adults were asked, “What veggies do you love?” Their responses are shown in this picture graph.
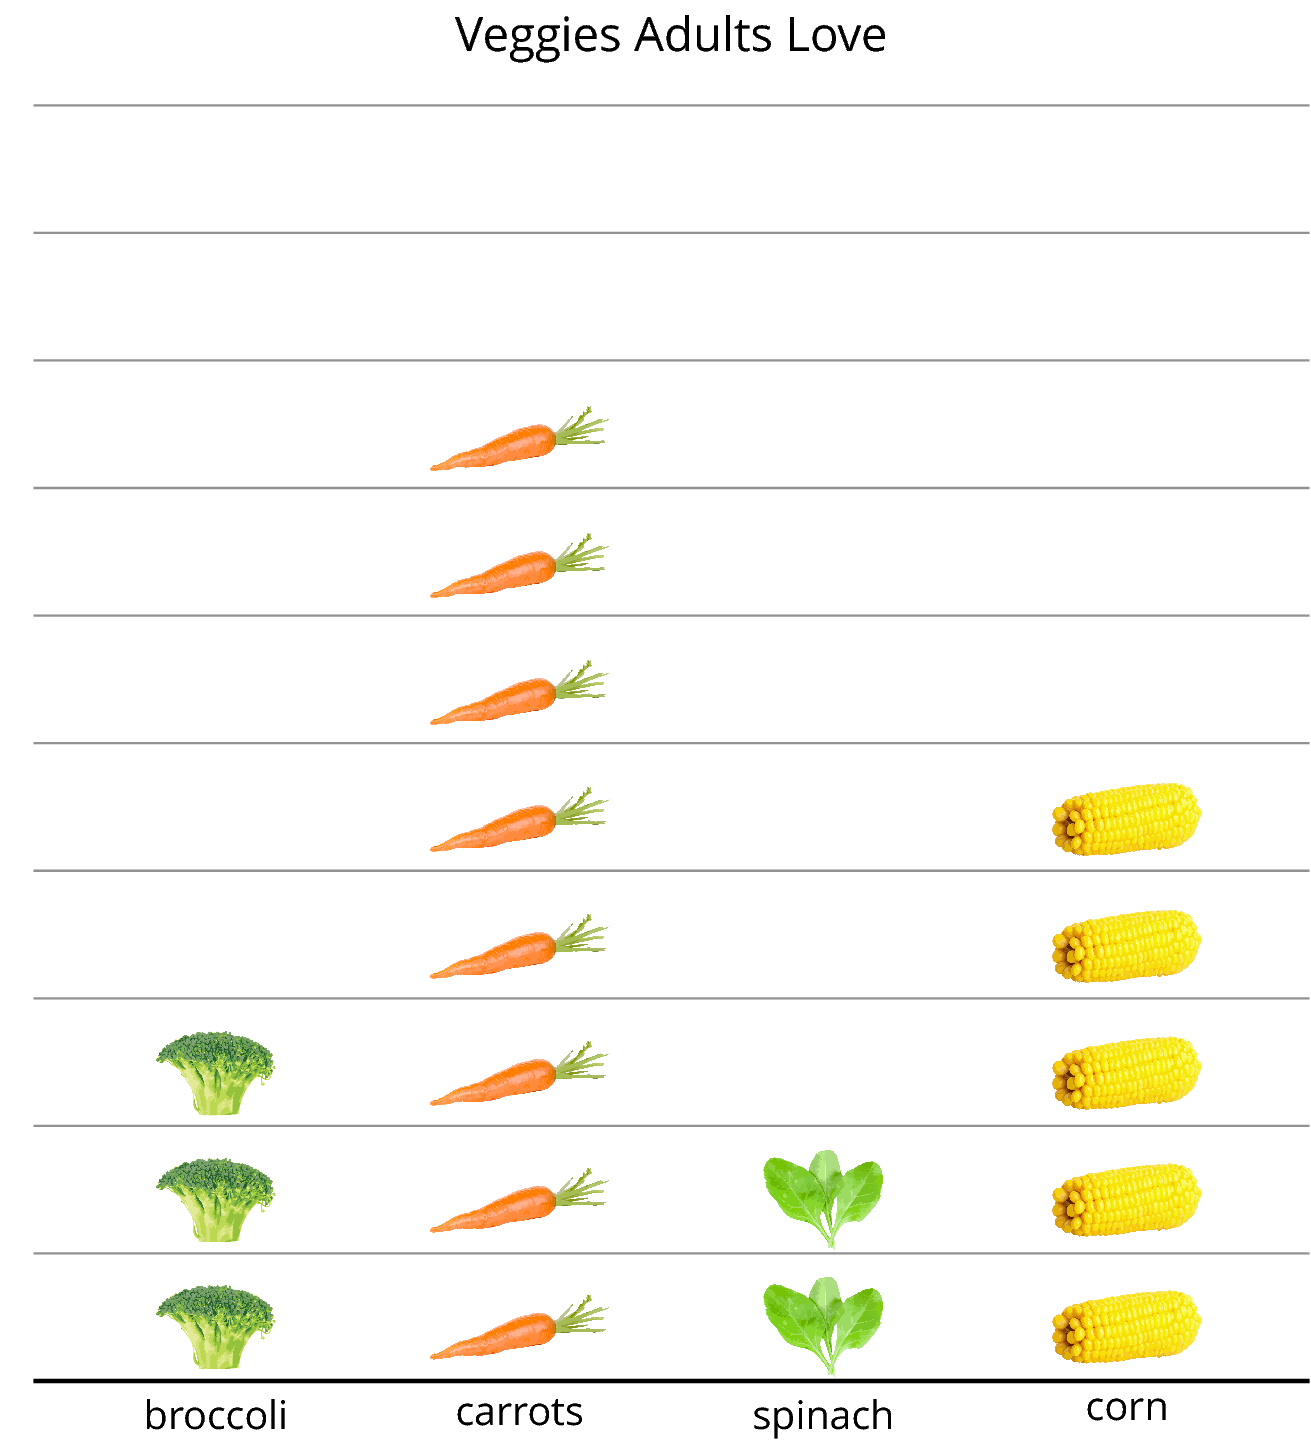
Answer the questions based on the graph.
- How many adults like spinach?
- What is the total number of adults who like carrots or corn? Show your thinking using drawings, numbers, or words.
-
Write one fact you learned about the veggies adults love based on the data represented in the picture graph.
Student Response
For access, consult one of our IM Certified Partners.
Advancing Student Thinking
If students' response for the number of adults that like carrots or corn doesn't clearly reflect the combined categories, consider asking:
- "Can you explain how you found the total number of adults who like carrots or corn?"
- "Where do you see this in the graph?"
Activity Synthesis
- Display “Veggies Adults Love” graph.
- “How many more adults like carrots than spinach? Explain how you know.” (6 more adults like carrots than spinach. I saw there were 2 for spinach, so I counted the carrots above 2. I did \(8 - 2 = 6\) because there were 8 votes for carrots and 2 for spinach.)
- 30 seconds: quiet think time
- Share and record responses
Activity 2: Answer Questions (15 minutes)
Narrative
The purpose of this activity is for students to interpret data represented in a picture graph. Students make sense of questions related to the context and decide whether questions can be answered with the data. This type of reasoning helps students make sense of the mathematical elements in a context and interpret and use the data presented in the picture graph to answer questions (MP4). When students read the graph and use methods based on using addition and subtraction or those based on counting on or back from the pictures in the graph, they reason abstractly and quantitatively (MP2).
Supports accessibility for: Conceptual Processing
Launch
- Groups of 2
Activity
- “Some questions can be answered using a picture graph, but some questions cannot.”
- “Circle any question that can be answered using the graph.”
- “Then, use the picture graph to answer the questions.”
- 8 minutes: independent work time
- Compare your responses with a partner.
- 2 minutes: partner discussion
- Monitor for students who explain how they:
- counted on to find the sum of two categories
- counted on to find how many more
- counted the number of pictures in each category and used addition or subtraction
Student Facing
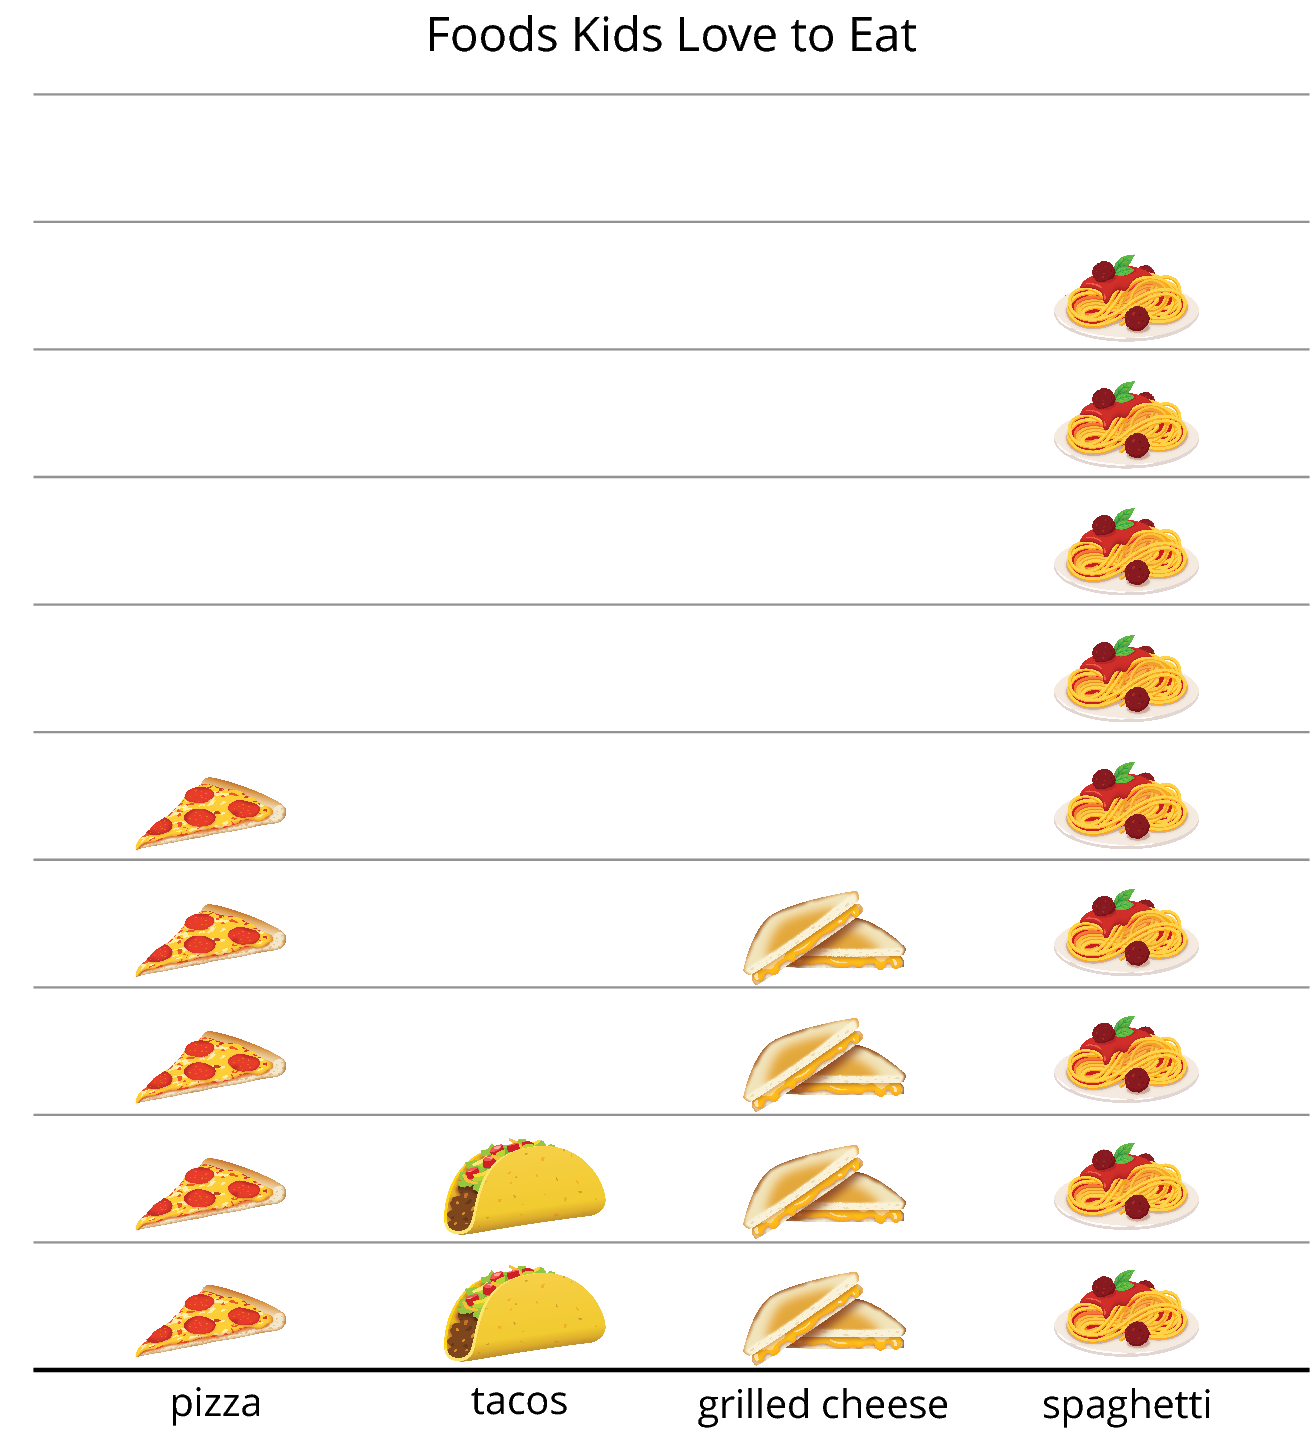
A group of kids were asked, “What foods do you love to eat?” Their responses are shown in this picture graph.
-
Circle the 4 questions that can be answered using the graph.
- How many kids chose pizza?
- How many chose tacos or grilled cheese?
- Why did so many kids choose spaghetti?
- How many more kids chose pizza than tacos?
- What is the total number of kids who chose spaghetti or pizza?
- Answer each question you circled.
Student Response
For access, consult one of our IM Certified Partners.
Advancing Student Thinking
If students combine categories when they should find the difference between them, consider asking:
- "How did you decide to combine these two groups?"
- "How could the graph help you think about how many more chose pizza?"
- "How does this match the question?"
Activity Synthesis
- “Which question did you decide couldn’t be answered? Explain.” (We don't know why so many kids chose spaghetti. The graph shows how many, but not their reasons.)
- Invite previously identified students to share responses for the questions that asked them to combine categories or compare categories.
Lesson Synthesis
Lesson Synthesis
Cool-down: Use a Picture Graph (5 minutes)
Cool-Down
For access, consult one of our IM Certified Partners.