Lesson 17
Two Related Quantities, Part 1
Let’s use equations and graphs to describe relationships with ratios.
17.1: Which One Would You Choose?
Which one would you choose? Be prepared to explain your reasoning.
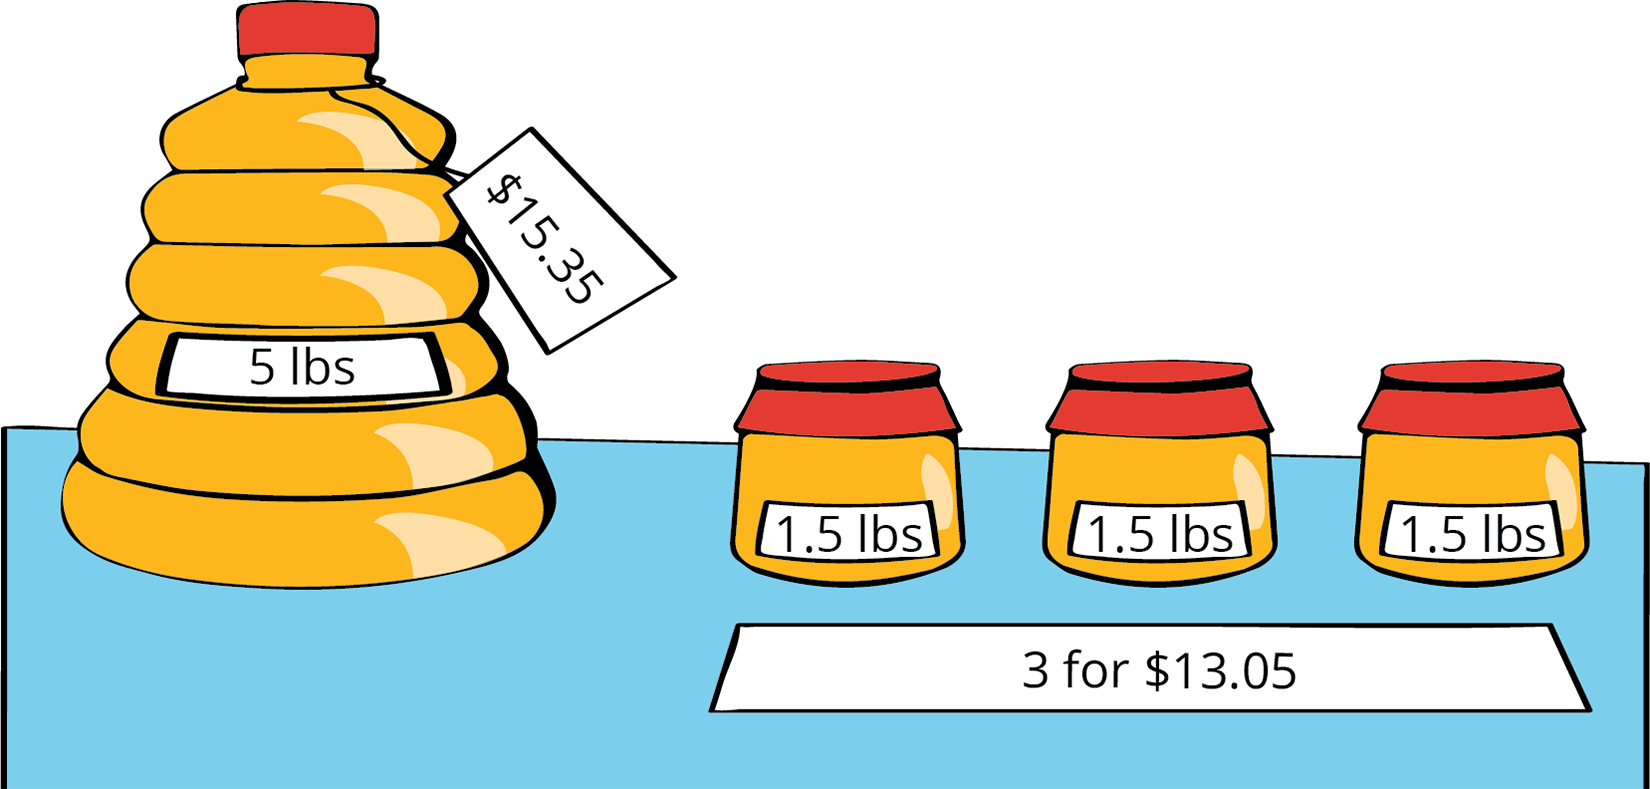
- A 5-pound jug of honey for $15.35
- Three 1.5-pound jars of honey for $13.05
17.2: Painting the Set
Lin needs to mix a specific shade of orange paint for the set of the school play. The color uses 3 parts yellow for every 2 parts red.
-
Complete the table to show different combinations of red and yellow paint that will make the shade of orange Lin needs.
cups of red paint \((r)\) cups of yellow paint \((y)\) total cups of paint \((t)\) 2 3 6 20 18 14 16 50 42 -
Lin notices that the number of cups of red paint is always \(\frac25\) of the total number of cups. She writes the equation \(r=\frac25 t\) to describe the relationship. Which is the independent variable? Which is the dependent variable? Explain how you know.
-
Write an equation that describes the relationship between \(r\) and \(y\) where \(y\) is the independent variable.
-
Write an equation that describes the relationship between \(y\) and \(r\) where \(r\) is the independent variable.
-
Use the points in the table to create two graphs that show the relationship between \(r\) and \(y\). Match each relationship to one of the equations you wrote.
A fruit stand sells apples, peaches, and tomatoes. Today, they sold 4 apples for every 5 peaches. They sold 2 peaches for every 3 tomatoes. They sold 132 pieces of fruit in total. How many of each fruit did they sell?
Summary
Equations are very useful for describing sets of equivalent ratios. Here is an example.
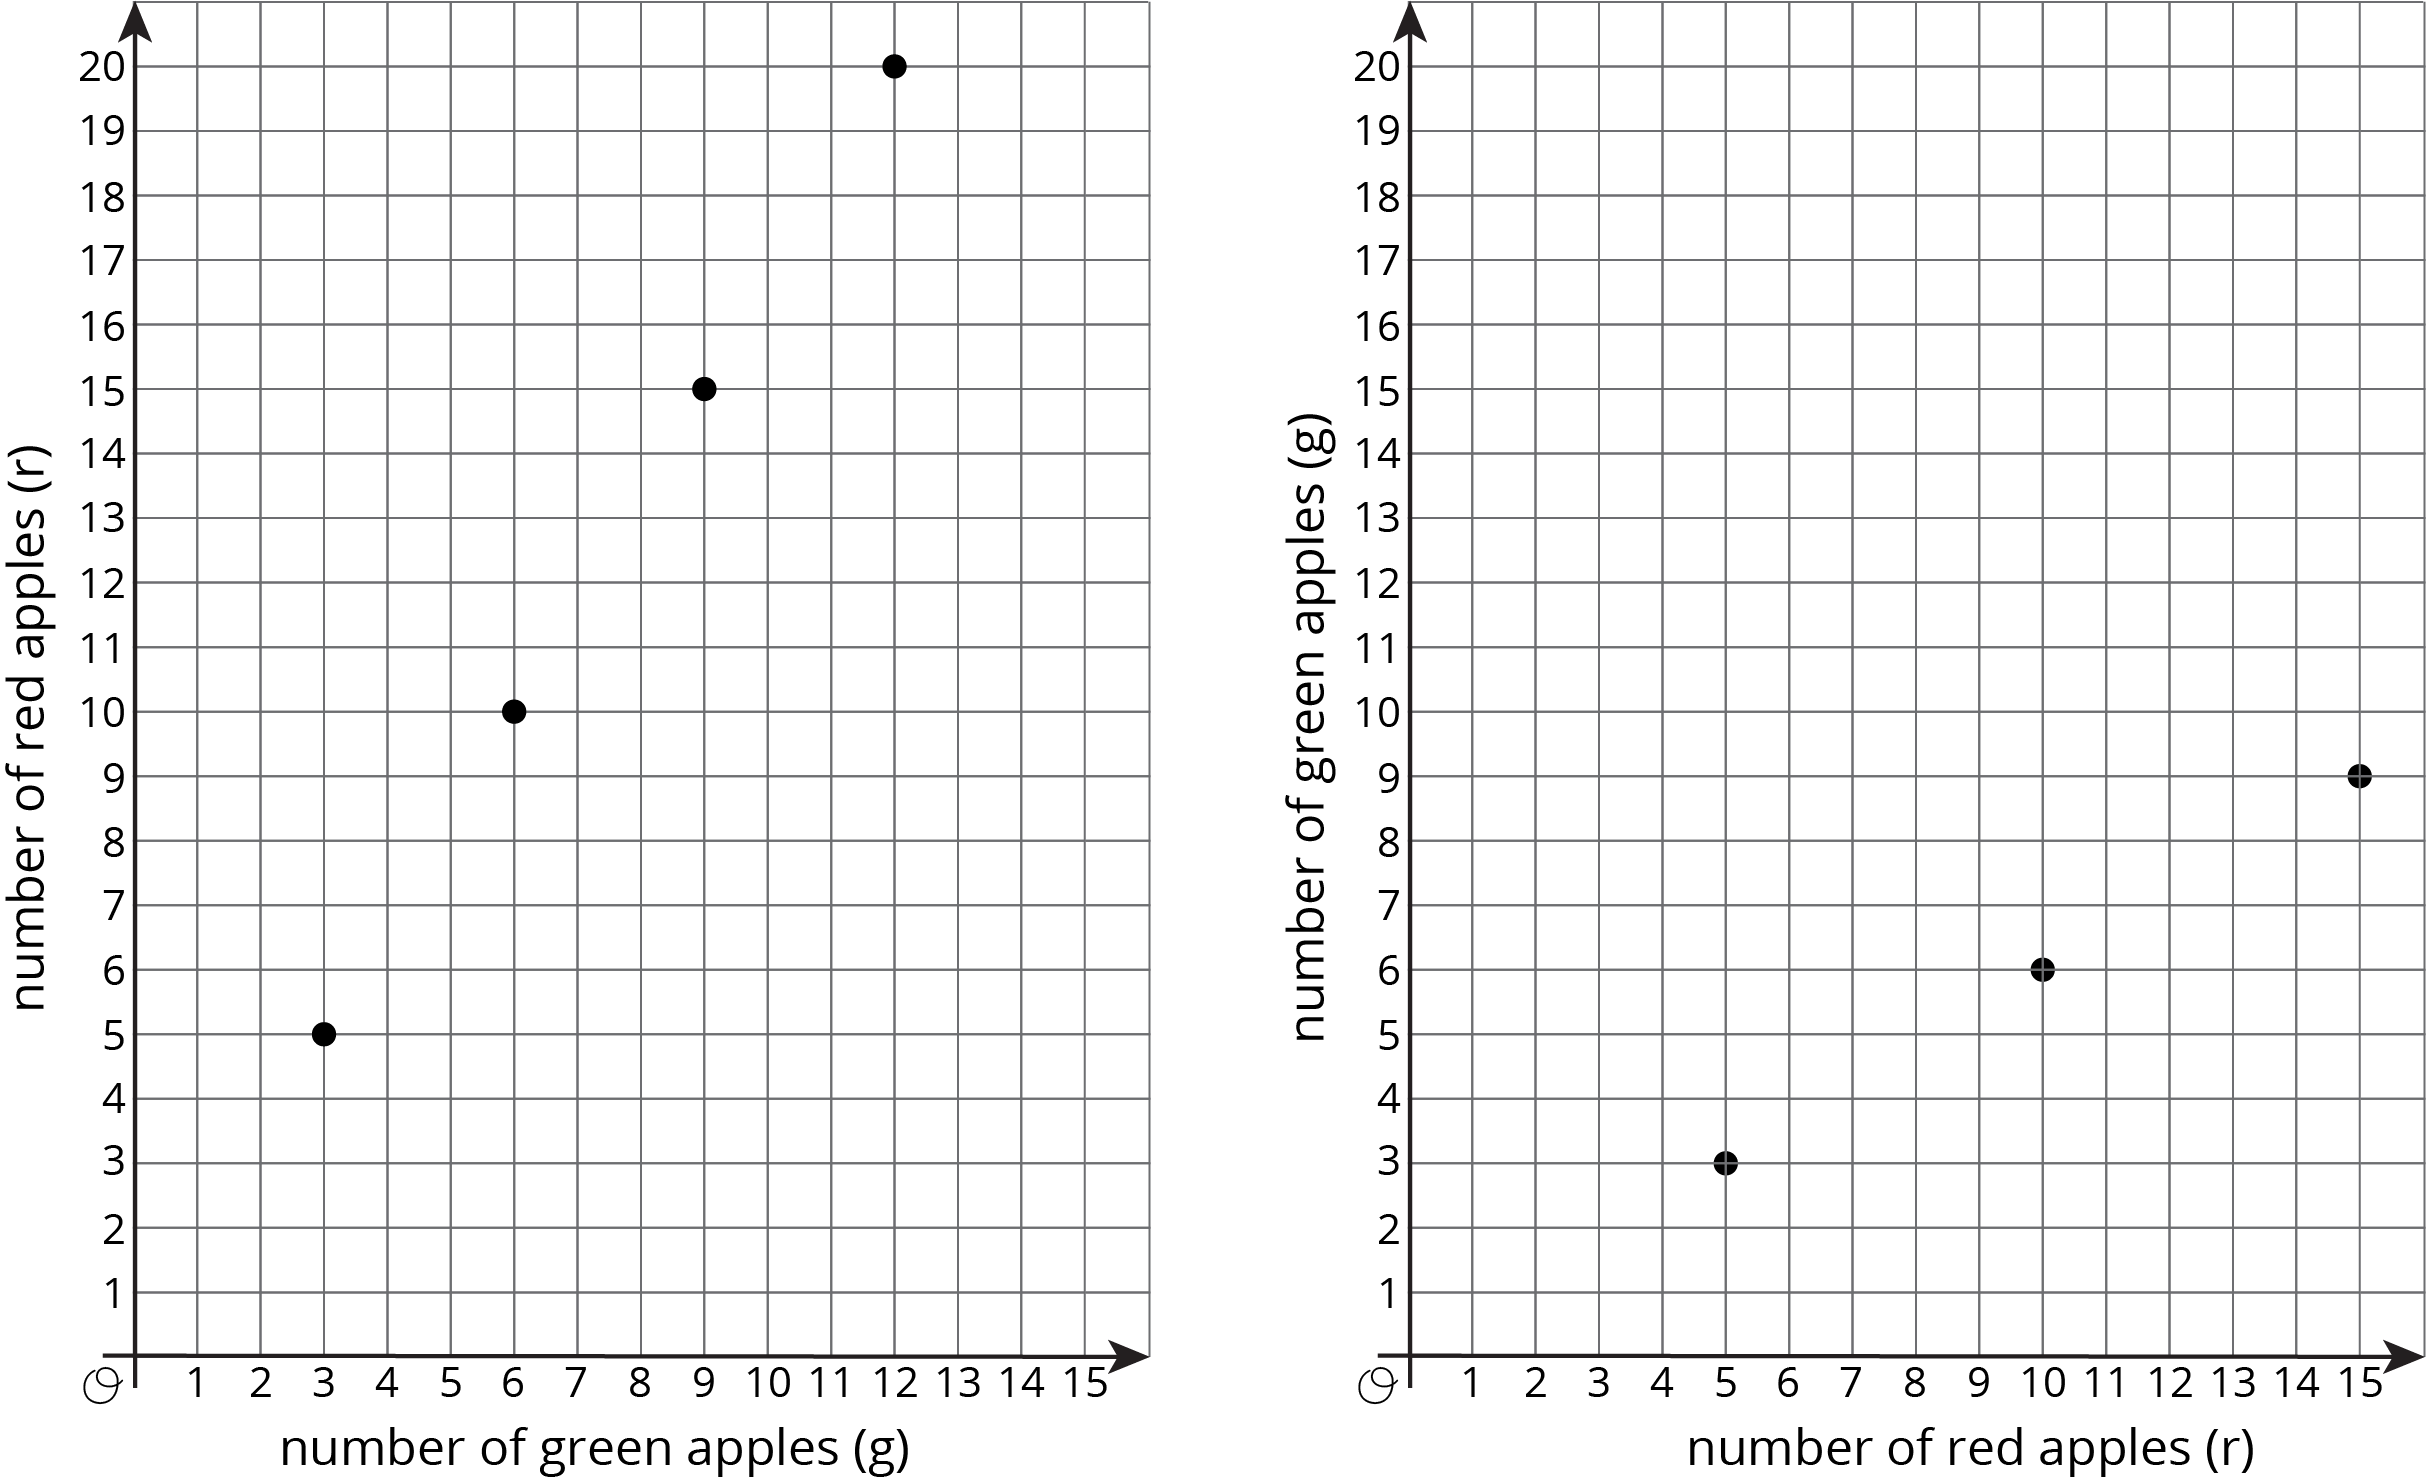
A pie recipe calls for 3 green apples for every 5 red apples. We can create a table to show some equivalent ratios.
We can see from the table that \(r\) is always \(\frac53\) as large as \(g\) and that \(g\) is always \(\frac35\) as large as \(r\).
| green apples (\(g\)) | red apples (\(r\)) |
|---|---|
| 3 | 5 |
| 6 | 10 |
| 9 | 15 |
| 12 | 20 |
We can write equations to describe the relationship between \(g\) and \(r\).
-
When we know the number of green apples and want to find the number of red apples, we can write:
\(\displaystyle r=\frac53g\)
In this equation, if \(g\) changes, \(r\) is affected by the change, so we refer to \(g\) as the independent variable and \(r\) as the dependent variable.
We can use this equation with any value of \(g\) to find \(r\). If 270 green apples are used, then \(\frac53 \boldcdot (270)\) or 450 red apples are used.
-
When we know the number of red apples and want to find the number of green apples, we can write:
\(\displaystyle g=\frac35r\)
In this equation, if \(r\) changes, \(g\) is affected by the change, so we refer to \(r\) as the independent variable and \(g\) as the dependent variable.
We can use this equation with any value of \(r\) to find \(g\). If 275 red apples are used, then \(\frac35 \boldcdot (275)\) or 165 green apples are used.
We can also graph the two equations we wrote to get a visual picture of the relationship between the two quantities.
Glossary Entries
- dependent variable
The dependent variable is the result of a calculation.
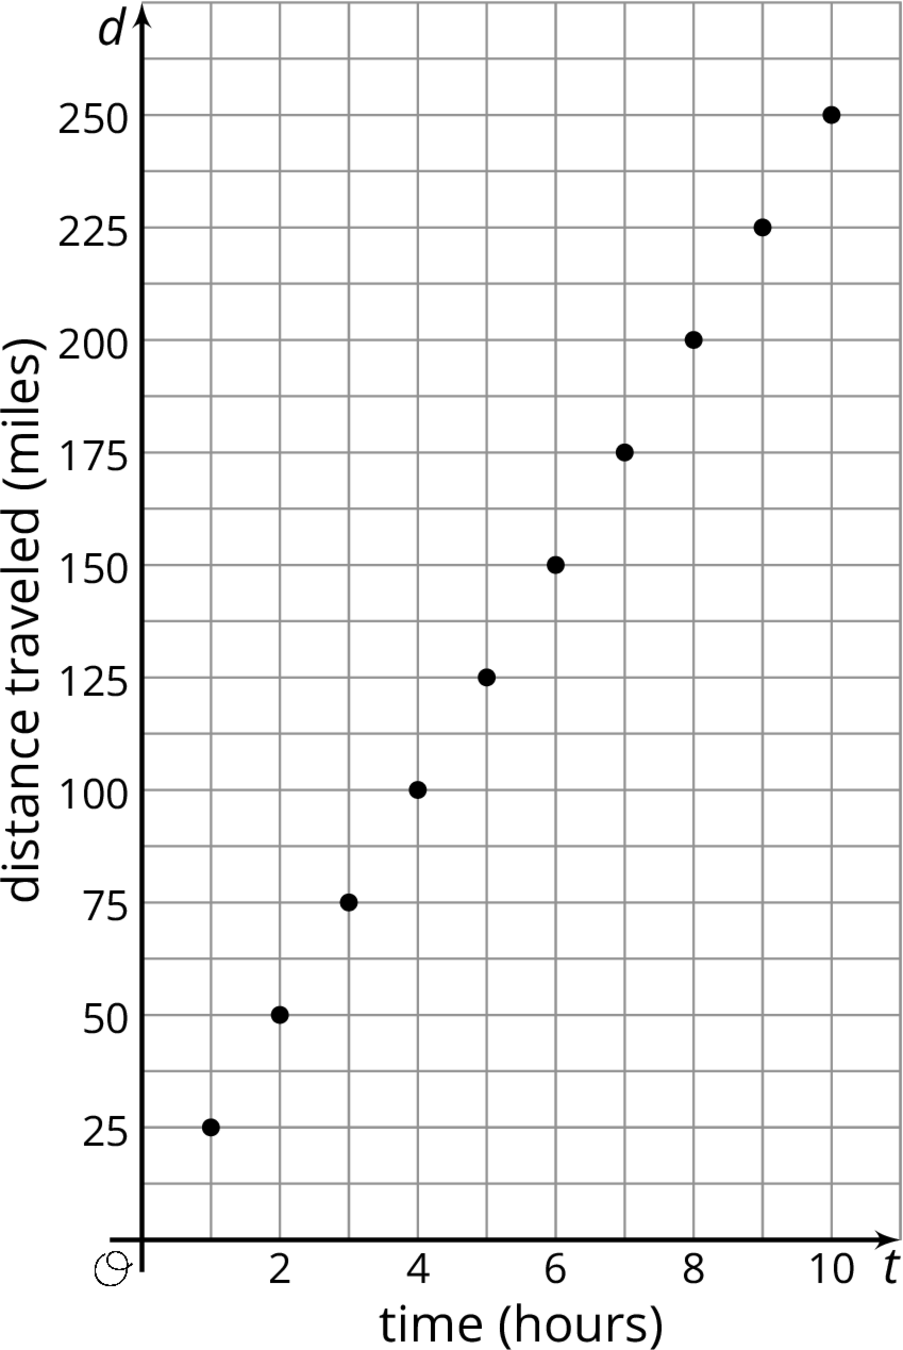
For example, a boat travels at a constant speed of 25 miles per hour. The equation \(d=25t\) describes the relationship between the boat's distance and time. The dependent variable is the distance traveled, because \(d\) is the result of multiplying 25 by \(t\).
- independent variable
The independent variable is used to calculate the value of another variable.
For example, a boat travels at a constant speed of 25 miles per hour. The equation \(d=25t\) describes the relationship between the boat's distance and time. The independent variable is time, because \(t\) is multiplied by 25 to get \(d\).