Glossary
absolute valueThe absolute value of a number is its distance from 0 on the number line.
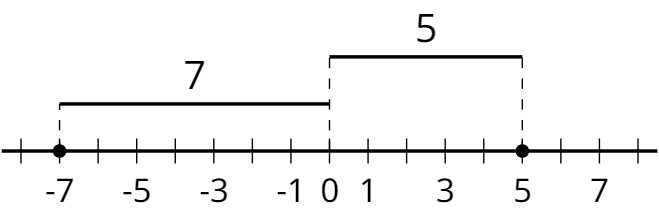
The absolute value of -7 is 7, because it is 7 units away from 0. The absolute value of 5 is 5, because it is 5 units away from 0.
area
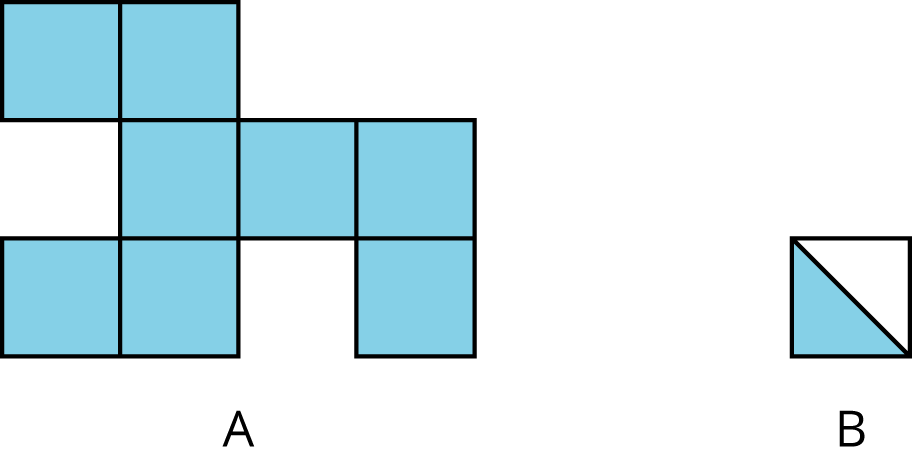
Area is the number of square units that cover a two-dimensional region, without any gaps or overlaps.
For example, the area of region A is 8 square units. The area of the shaded region of B is \(\frac12\) square unit.
average
The average is another name for the mean of a data set.
For the data set 3, 5, 6, 8, 11, 12, the average is 7.5.
\(3+5+6+8+11+12=45\)
\(45 \div 6 = 7.5\)
base (of a parallelogram or triangle)
We can choose any side of a parallelogram or triangle to be the shape’s base. Sometimes we use the word base to refer to the length of this side.

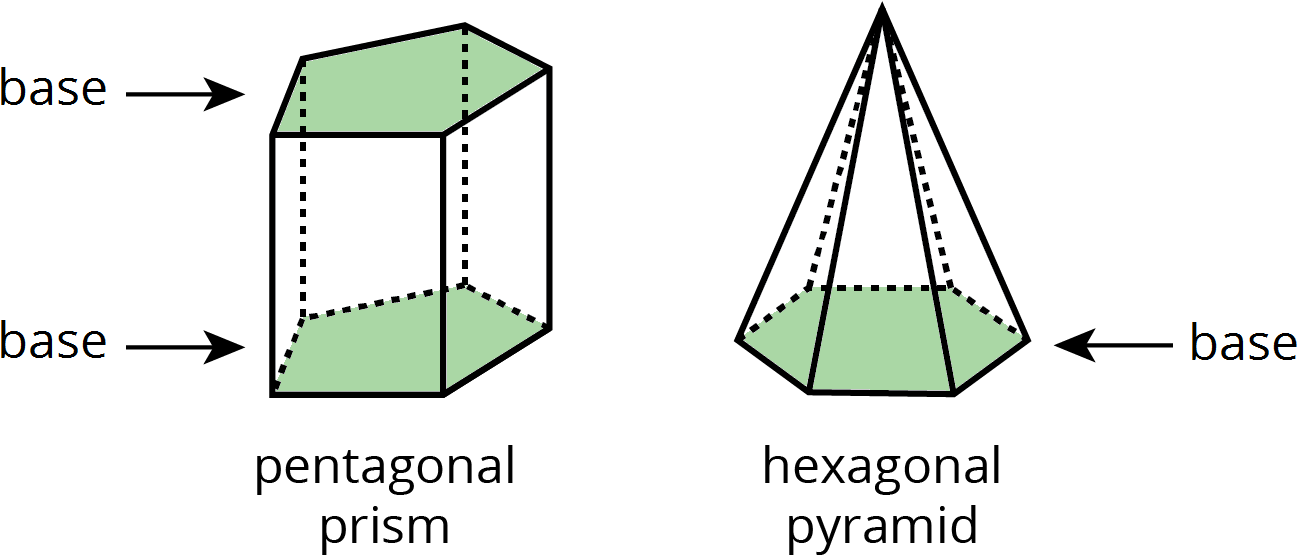
base (of a prism or pyramid)
The word base can also refer to a face of a polyhedron.
A prism has two identical bases that are parallel. A pyramid has one base.
A prism or pyramid is named for the shape of its base.
box plot
A box plot is a way to represent data on a number line. The data is divided into four sections. The sides of the box represent the first and third quartiles. A line inside the box represents the median. Lines outside the box connect to the minimum and maximum values.
For example, this box plot shows a data set with a minimum of 2 and a maximum of 15. The median is 6, the first quartile is 5, and the third quartile is 10.

categorical data
A set of categorical data has values that are words instead of numbers.
For example, Han asks 5 friends to name their favorite color. Their answers are: blue, blue, green, blue, orange.
center
The center of a set of numerical data is a value in the middle of the distribution. It represents a typical value for the data set.
For example, the center of this distribution of cat weights is between 4.5 and 5 kilograms.

coefficient
A coefficient is a number that is multiplied by a variable.
For example, in the expression \(3x+5\), the coefficient of \(x\) is 3. In the expression \(y+5\), the coefficient of \(y\) is 1, because \(y=1 \boldcdot y\).
common factor
A common factor of two numbers is a number that divides evenly into both numbers. For example, 5 is a common factor of 15 and 20, because \(15 \div 5 = 3\) and \(20 \div 5 = 4\). Both of the quotients, 3 and 4, are whole numbers.
- The factors of 15 are 1, 3, 5, and 15.
- The factors of 20 are 1, 2, 4, 5, 10, and 20.
common multiple
A common multiple of two numbers is a product you can get by multiplying each of the two numbers by some whole number. For example, 30 is a common multiple of 3 and 5, because \(3 \cdot 10 = 30\) and \(5 \cdot 6 = 30\). Both of the factors, 10 and 6, are whole numbers.
- The multiples of 3 are 3, 6, 9, 12, 15, 18, 21, 24, 27, 30, 33 . . .
- The multiples of 5 are 5, 10, 15, 20, 25, 30, 35, 40 . . .
The common multiples of 3 and 5 are 15, 30, 45, 60 . . .
compose
Compose means “put together.” We use the word compose to describe putting more than one figure together to make a new shape.

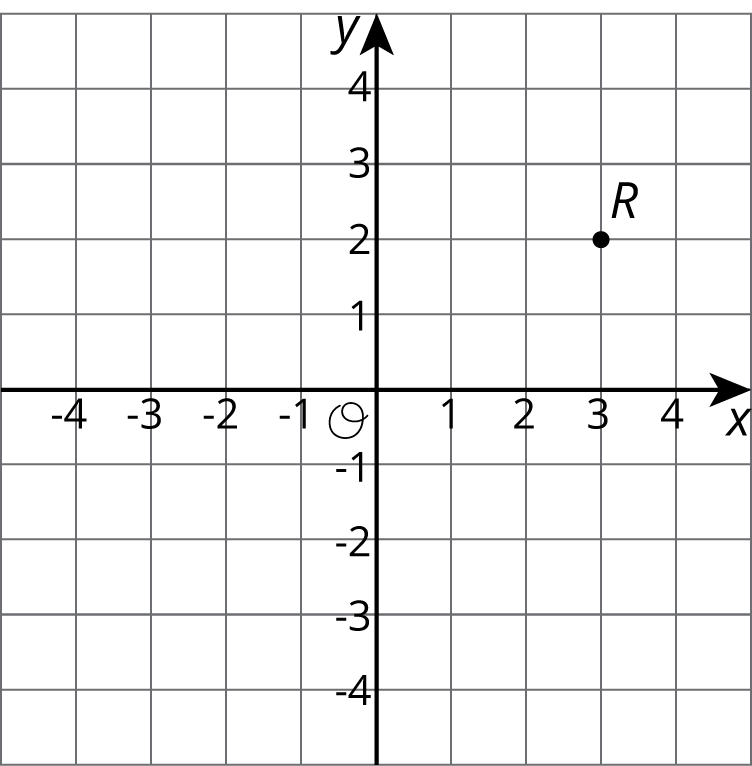
coordinate plane
The coordinate plane is a system for telling where points are. For example. point \(R\) is located at \((3, 2)\) on the coordinate plane, because it is three units to the right and two units up.
cubed
We use the word cubed to mean “to the third power.” This is because a cube with side length \(s\) has a volume of \(s \boldcdot s \boldcdot s\), or \(s^3\).
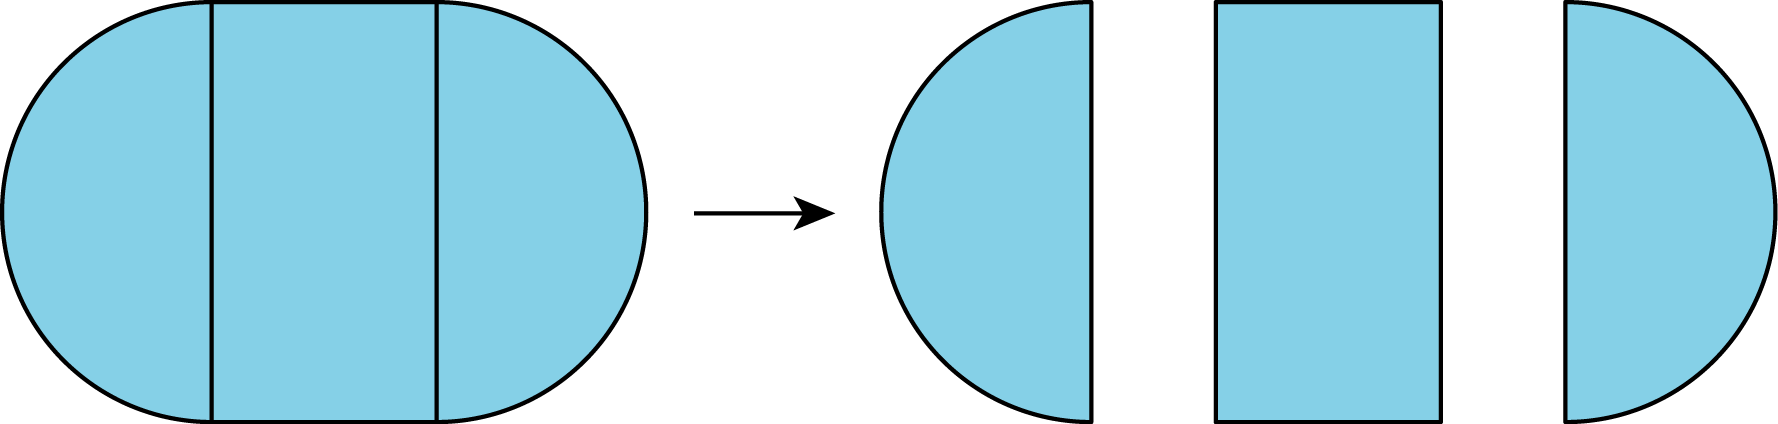
decompose
Decompose means “take apart.” We use the word decompose to describe taking a figure apart to make more than one new shape.
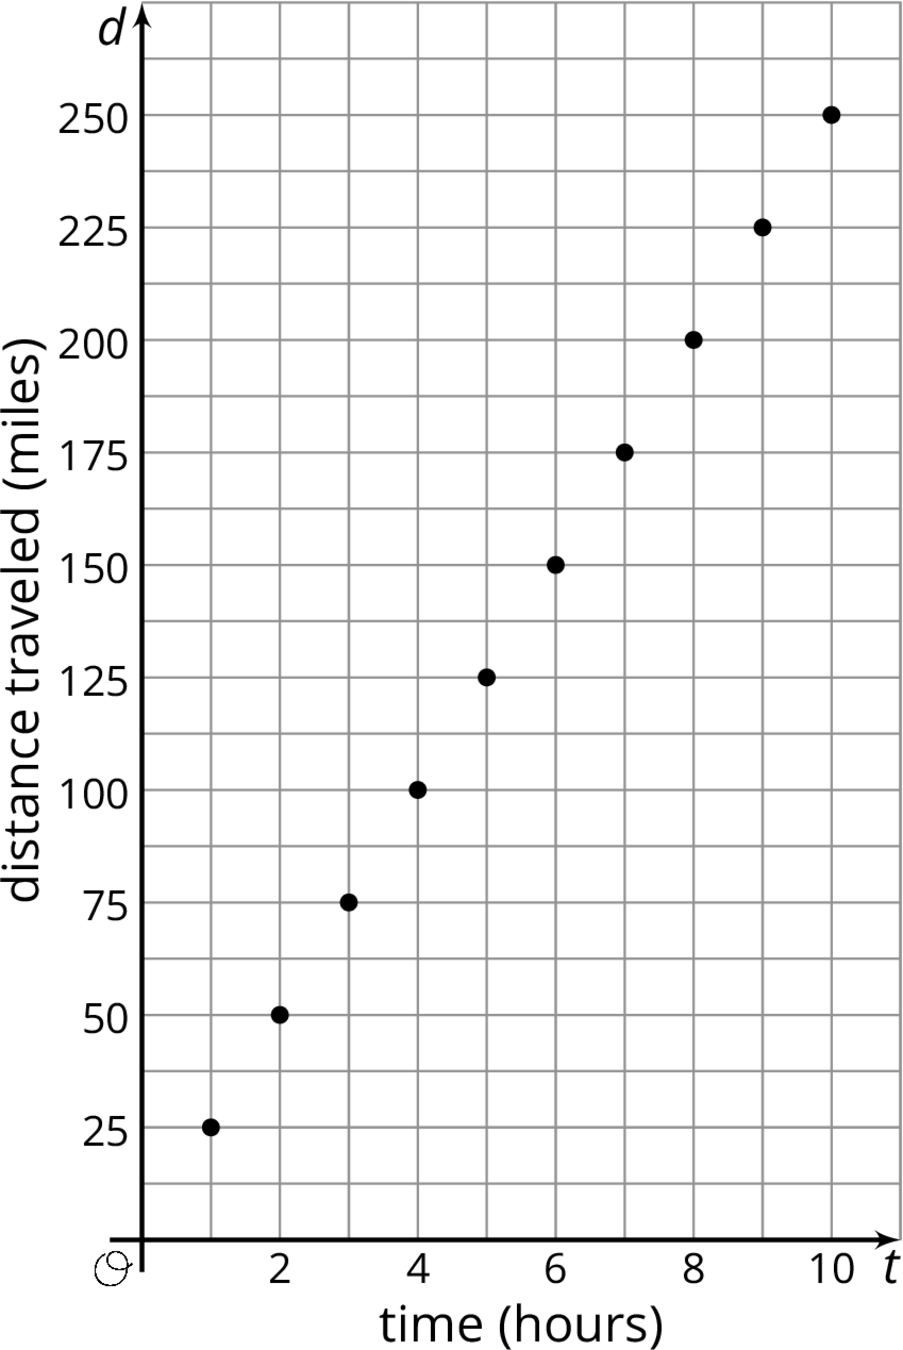
dependent variable
The dependent variable is the result of a calculation.
For example, a boat travels at a constant speed of 25 miles per hour. The equation \(d=25t\) describes the relationship between the boat's distance and time. The dependent variable is the distance traveled, because \(d\) is the result of multiplying 25 by \(t\).
distribution
The distribution tells how many times each value occurs in a data set. For example, in the data set blue, blue, green, blue, orange, the distribution is 3 blues, 1 green, and 1 orange.
Here is a dot plot that shows the distribution for the data set 6, 10, 7, 35, 7, 36, 32, 10, 7, 35.

dot plot
A dot plot is a way to represent data on a number line. Each time a value appears in the data set, we put another dot above that number on the number line.
For example, in this dot plot there are three dots above the 9. This means that three different plants had a height of 9 cm.

double number line diagram
A double number line diagram uses a pair of parallel number lines to represent equivalent ratios. The locations of the tick marks match on both number lines. The tick marks labeled 0 line up, but the other numbers are usually different.

edge
Each straight side of a polygon is called an edge.
For example, the edges of this polygon are segments \(AB\), \(BC\), \(CD\), \(DE\), and \(EA\).

equivalent expressions
Equivalent expressions are always equal to each other. If the expressions have variables, they are equal whenever the same value is used for the variable in each expression.
For example, \(3x+4x\) is equivalent to \(5x+2x\). No matter what value we use for \(x\), these expressions are always equal. When \(x\) is 3, both expressions equal 21. When \(x\) is 10, both expressions equal 70.
equivalent ratios
Two ratios are equivalent if you can multiply each of the numbers in the first ratio by the same factor to get the numbers in the second ratio. For example, \(8:6\) is equivalent to \(4:3\), because \(8\boldcdot\frac12 = 4\) and \(6\boldcdot\frac12 = 3\).
A recipe for lemonade says to use 8 cups of water and 6 lemons. If we use 4 cups of water and 3 lemons, it will make half as much lemonade. Both recipes taste the same, because \(8:6\) and \(4:3\) are equivalent ratios.
| cups of water | number of lemons |
|---|---|
| 8 | 6 |
| 4 | 3 |
exponent
In expressions like \(5^3\) and \(8^2\), the 3 and the 2 are called exponents. They tell you how many factors to multiply. For example, \(5^3\) = \(5 \boldcdot 5 \boldcdot 5\), and \(8^2 = 8 \boldcdot 8\).
face
Each flat side of a polyhedron is called a face. For example, a cube has 6 faces, and they are all squares.
frequency
The frequency of a data value is how many times it occurs in the data set.
For example, there were 20 dogs in a park. The table shows the frequency of each color.
| color | frequency |
|---|---|
| white | 4 |
| brown | 7 |
| black | 3 |
| multi-color | 6 |
greatest common factor
The greatest common factor of two numbers is the largest number that divides evenly into both numbers. Sometimes we call this the GCF. For example, 15 is the greatest common factor of 45 and 60.
- The factors of 45 are 1, 3, 5, 9, 15, and 45.
- The factors of 60 are 1, 2, 3, 4, 5, 6, 10, 12, 15, 20, 30, and 60.
height (of a parallelogram or triangle)
The height is the shortest distance from the base of the shape to the opposite side (for a parallelogram) or opposite vertex (for a triangle).
We can show the height in more than one place, but it will always be perpendicular to the chosen base.

histogram
A histogram is a way to represent data on a number line. Data values are grouped by ranges. The height of the bar shows how many data values are in that group.
This histogram shows there were 10 people who earned 2 or 3 tickets. We can't tell how many of them earned 2 tickets or how many earned 3. Each bar includes the left-end value but not the right-end value. (There were 5 people who earned 0 or 1 tickets and 13 people who earned 6 or 7 tickets.)

independent variable
The independent variable is used to calculate the value of another variable.
For example, a boat travels at a constant speed of 25 miles per hour. The equation \(d=25t\) describes the relationship between the boat's distance and time. The independent variable is time, because \(t\) is multiplied by 25 to get \(d\).
interquartile range (IQR)
The interquartile range is one way to measure how spread out a data set is. We sometimes call this the IQR. To find the interquartile range we subtract the first quartile from the third quartile.
For example, the IQR of this data set is 20 because \(50-30=20\).
| 22 | 29 | 30 | 31 | 32 | 43 | 44 | 45 | 50 | 50 | 59 |
| Q1 | Q2 | Q3 |
least common multiple
The least common multiple of two numbers is the smallest product you can get by multiplying each of the two numbers by some whole number. Sometimes we call this the LCM. For example, 30 is the least common multiple of 6 and 10.
- The multiples of 6 are 6, 12, 18, 24, 30, 36, 42, 48, 54, 60 . . .
- The multiples of 10 are 10, 20, 30, 40, 50, 60, 70, 80 . . .
long division
Long division is a way to show the steps for dividing numbers in decimal form. It finds the quotient one digit at a time, from left to right.
For example, here is the long division for \(57 \div 4\).
\(\displaystyle \require{enclose} \begin{array}{r} 14.25 \\[-3pt] 4 \enclose{longdiv}{57.00}\kern-.2ex \\[-3pt] \underline{-4\phantom {0}}\phantom{.00} \\[-3pt] 17\phantom {.00} \\[-3pt]\underline{-16}\phantom {.00}\\[-3pt]{10\phantom{.0}} \\[-3pt]\underline{-8}\phantom{.0}\\ \phantom{0}20 \\[-3pt] \underline{-20} \\[-3pt] \phantom{00}0 \end{array} \)
mean
The mean is one way to measure the center of a data set. We can think of it as a balance point. For example, for the data set 7, 9, 12, 13, 14, the mean is 11.

To find the mean, add up all the numbers in the data set. Then, divide by how many numbers there are. \(7+9+12+13+14=55\) and \(55 \div 5 = 11\).
mean absolute deviation (MAD)
The mean absolute deviation is one way to measure how spread out a data set is. Sometimes we call this the MAD. For example, for the data set 7, 9, 12, 13, 14, the MAD is 2.4. This tells us that these travel times are typically 2.4 minutes away from the mean, which is 11.
To find the MAD, add up the distance between each data point and the mean. Then, divide by how many numbers there are.
\(4+2+1+2+3=12\) and \(12 \div 5 = 2.4\)
measure of center
A measure of center is a value that seems typical for a data distribution.
Mean and median are both measures of center.
median
The median is one way to measure the center of a data set. It is the middle number when the data set is listed in order.
For the data set 7, 9, 12, 13, 14, the median is 12.
For the data set 3, 5, 6, 8, 11, 12, there are two numbers in the middle. The median is the average of these two numbers. \(6+8=14\) and \(14 \div 2 = 7\).
meters per second
Meters per second is a unit for measuring speed. It tells how many meters an object goes in one second.
For example, a person walking 3 meters per second is going faster than another person walking 2 meters per second.
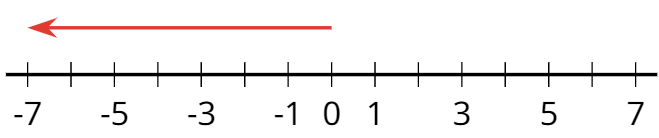
negative number
A negative number is a number that is less than zero. On a horizontal number line, negative numbers are usually shown to the left of 0.
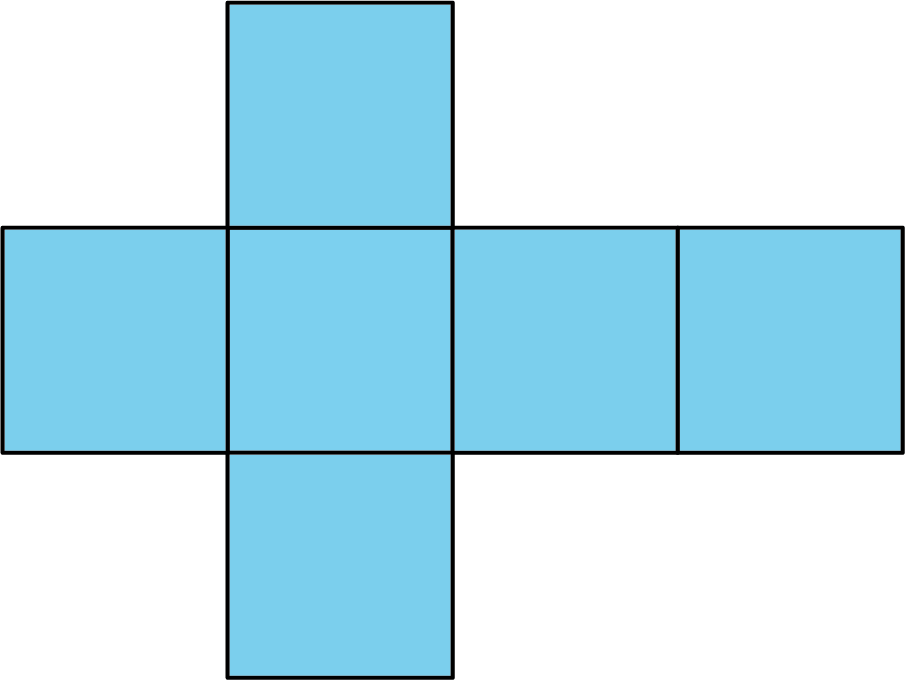
net
A net is a two-dimensional figure that can be folded to make a polyhedron.
Here is a net for a cube.
numerical data
A set of numerical data has values that are numbers.
For example, Han lists the ages of people in his family: 7, 10, 12, 36, 40, 67.
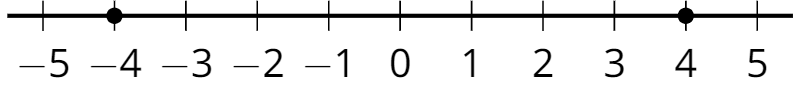
opposite
Two numbers are opposites if they are the same distance from 0 and on different sides of the number line.
For example, 4 is the opposite of -4, and -4 is the opposite of 4. They are both the same distance from 0. One is negative, and the other is positive.
opposite vertex
For each side of a triangle, there is one vertex that is not on that side. This is the opposite vertex.
For example, point \(A\) is the opposite vertex to side \(BC\).

pace
Pace is one way to describe how fast something is moving. Pace tells how much time it takes the object to travel a certain distance.
For example, Diego walks at a pace of 10 minutes per mile. Elena walks at a pace of 11 minutes per mile. Elena walks slower than Diego, because it takes her more time to travel the same distance.
parallelogram
A parallelogram is a type of quadrilateral that has two pairs of parallel sides.
Here are two examples of parallelograms.

per
The word per means “for each.” For example, if the price is $5 per ticket, that means you will pay $5 for each ticket. Buying 4 tickets would cost $20, because \(4 \boldcdot 5 = 20\).
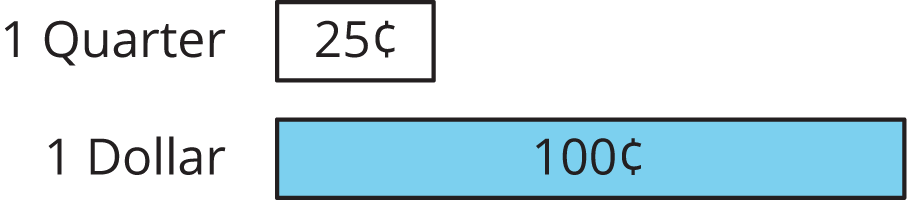
percent
The word percent means “for each 100.” The symbol for percent is %.
For example, a quarter is worth 25 cents, and a dollar is worth 100 cents. We can say that a quarter is worth 25% of a dollar.

percentage
A percentage is a rate per 100.
For example, a fish tank can hold 36 liters. Right now there is 27 liters of water in the tank. The percentage of the tank that is full is 75%.

polygon
A polygon is a closed, two-dimensional shape with straight sides that do not cross each other.
Figure \(ABCDE\) is an example of a polygon.

polyhedron
A polyhedron is a closed, three-dimensional shape with flat sides. When we have more than one polyhedron, we call them polyhedra.
Here are some drawings of polyhedra.

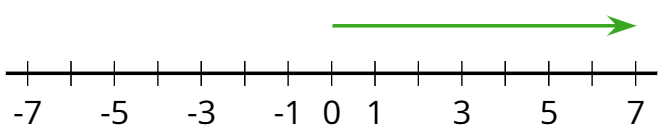
positive number
A positive number is a number that is greater than zero. On a horizontal number line, positive numbers are usually shown to the right of 0.
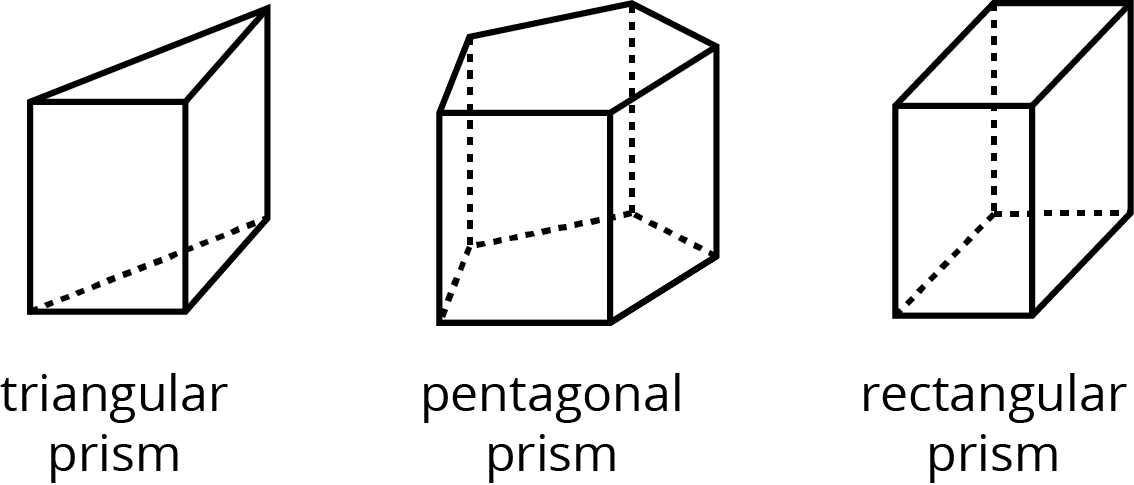
prism
A prism is a type of polyhedron that has two bases that are identical copies of each other. The bases are connected by rectangles or parallelograms.
Here are some drawings of prisms.
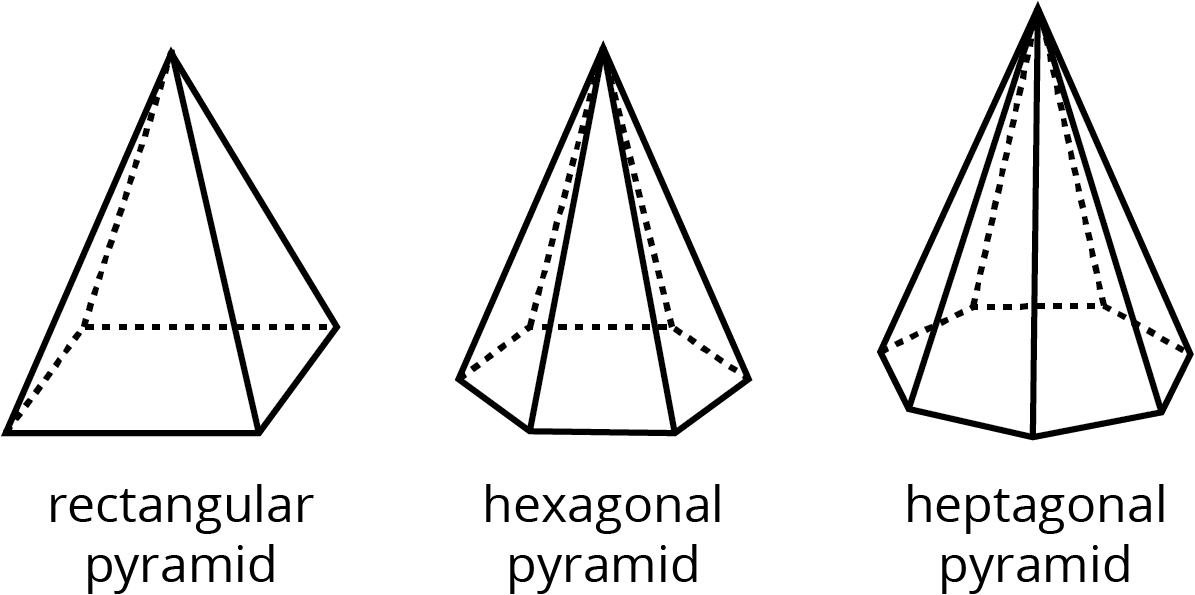
pyramid
A pyramid is a type of polyhedron that has one base. All the other faces are triangles, and they all meet at a single vertex.
Here are some drawings of pyramids.
quadrant
The coordinate plane is divided into 4 regions called quadrants. The quadrants are numbered using Roman numerals, starting in the top right corner.

quadrilateral
A quadrilateral is a type of polygon that has 4 sides. A rectangle is an example of a quadrilateral. A pentagon is not a quadrilateral, because it has 5 sides.
quartile
Quartiles are the numbers that divide a data set into four sections that each have the same number of values.
For example, in this data set the first quartile is 30. The second quartile is the same thing as the median, which is 43. The third quartile is 50.
| 22 | 29 | 30 | 31 | 32 | 43 | 44 | 45 | 50 | 50 | 59 |
| Q1 | Q2 | Q3 |
range
The range is the distance between the smallest and largest values in a data set. For example, for the data set 3, 5, 6, 8, 11, 12, the range is 9, because \(12-3=9\).
ratio
A ratio is an association between two or more quantities.
For example, the ratio \(3:2\) could describe a recipe that uses 3 cups of flour for every 2 eggs, or a boat that moves 3 meters every 2 seconds. One way to represent the ratio \(3:2\) is with a diagram that has 3 blue squares for every 2 green squares.

rational number
A rational number is a fraction or the opposite of a fraction.
For example, 8 and -8 are rational numbers because they can be written as \(\frac81\) and \(\text-\frac81\).
Also, 0.75 and -0.75 are rational numbers because they can be written as \(\frac{75}{100}\) and \(\text-\frac{75}{100}\).
reciprocal
Dividing 1 by a number gives the reciprocal of that number. For example, the reciprocal of 12 is \(\frac{1}{12}\), and the reciprocal of \(\frac25\) is \(\frac52\).
region
A region is the space inside of a shape. Some examples of two-dimensional regions are inside a circle or inside a polygon. Some examples of three-dimensional regions are the inside of a cube or the inside of a sphere.
same rate
We use the words same rate to describe two situations that have equivalent ratios.
For example, a sink is filling with water at a rate of 2 gallons per minute. If a tub is also filling with water at a rate of 2 gallons per minute, then the sink and the tub are filling at the same rate.
sign
The sign of any number other than 0 is either positive or negative.
For example, the sign of 6 is positive. The sign of -6 is negative. Zero does not have a sign, because it is not positive or negative.
solution to an equation
A solution to an equation is a number that can be used in place of the variable to make the equation true.
For example, 7 is the solution to the equation \(m+1=8\), because it is true that \(7+1=8\). The solution to \(m+1=8\) is not 9, because \(9+1 \ne 8\).
solution to an inequality
A solution to an inequality is a number that can be used in place of the variable to make the inequality true.
For example, 5 is a solution to the inequality \(c<10\), because it is true that \(5<10\). Some other solutions to this inequality are 9.9, 0, and -4.
speed
Speed is one way to describe how fast something is moving. Speed tells how much distance the object travels in a certain amount of time.
For example, Tyler walks at a speed of 4 miles per hour. Priya walks at a speed of 5 miles per hour. Priya walks faster than Tyler, because she travels more distance in the same amount of time.
spread
The spread of a set of numerical data tells how far apart the values are.
For example, the dot plots show that the travel times for students in South Africa are more spread out than for New Zealand.

squared
We use the word squared to mean “to the second power.” This is because a square with side length \(s\) has an area of \(s \boldcdot s\), or \(s^2\).
statistical question
A statistical question can be answered by collecting data that has variability. Here are some examples of statistical questions:
- Who is the most popular musical artist at your school?
- When do students in your class typically eat dinner?
- Which classroom in your school has the most books?
surface area
The surface area of a polyhedron is the number of square units that covers all the faces of the polyhedron, without any gaps or overlaps.
For example, if the faces of a cube each have an area of 9 cm2, then the surface area of the cube is \(6 \boldcdot 9\), or 54 cm2.
table
A table organizes information into horizontal rows and vertical columns. The first row or column usually tells what the numbers represent.
For example, here is a table showing the tail lengths of three different pets. This table has four rows and two columns.
| pet | tail length (inches) |
|---|---|
| dog | 22 |
| cat | 12 |
| mouse | 2 |
tape diagram
A tape diagram is a group of rectangles put together to represent a relationship between quantities.
For example, this tape diagram shows a ratio of 30 gallons of yellow paint to 50 gallons of blue paint.

If each rectangle were labeled 5, instead of 10, then the same picture could represent the equivalent ratio of 15 gallons of yellow paint to 25 gallons of blue paint.
term
A term is a part of an expression. It can be a single number, a variable, or a number and a variable that are multiplied together. For example, the expression \(5x + 18\) has two terms. The first term is \(5x\) and the second term is 18.
unit price
The unit price is the cost for one item or for one unit of measure. For example, if 10 feet of chain link fencing cost $150, then the unit price is \(150 \div 10\), or $15 per foot.
unit rate
A unit rate is a rate per 1.
For example, 12 people share 2 pies equally. One unit rate is 6 people per pie, because \(12 \div 2 = 6\). The other unit rate is \(\frac16\) of a pie per person, because \(2 \div 12 = \frac16\).
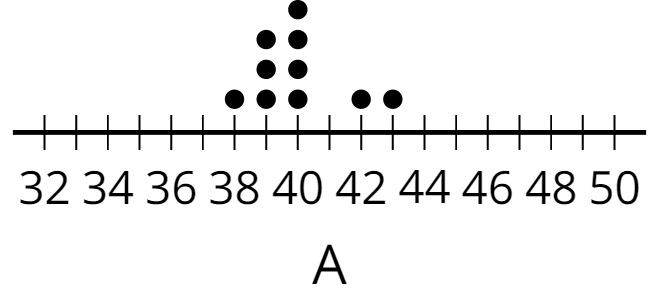
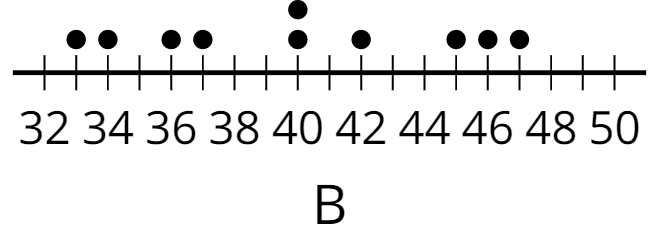
variability
Variability means having different values.
For example, data set B has more variability than data set A. Data set B has many different values, while data set A has more of the same values.
variable
A variable is a letter that represents a number. You can choose different numbers for the value of the variable.
For example, in the expression \(10-x\), the variable is \(x\). If the value of \(x\) is 3, then \(10-x=7\), because \(10-3=7\). If the value of \(x\) is 6, then \(10-x=4\), because \(10-6=4\).
vertex
A vertex is a point where two or more edges meet. When we have more than one vertex, we call them vertices.
The vertices in this polygon are labeled \(A\), \(B\), \(C\), \(D\), and \(E\).
volume
Volume is the number of cubic units that fill a three-dimensional region, without any gaps or overlaps.
For example, the volume of this rectangular prism is 60 units3, because it is composed of 3 layers that are each 20 units3.
