Lesson 6
Picking Representatives
6.1: Computers for Kids (10 minutes)
Activity
This activity introduces the question for the last five activities in the voting unit: How can we fairly share a small number of representatives between several groups of people?
The first question of the activity asks students to distribute computers to families with children. In this question, computers can be shared so that the same number of children share a computer in each family. In the second question, fair sharing is not possible, so students need to decide and explain which alternative is the fairest, or the least unfair (MP3). Monitor for students who chose different ways to distribute the computers.
Launch
Arrange students in groups of 2. Give students 5 minutes quiet think time and then ask them to compare their work with a partner.
Student Facing
A program gives computers to families with school-aged children. They have a certain number of computers to distribute fairly between several families. How many computers should each family get?
-
One month the program has 8 computers. The families have these numbers of school-aged children: 4, 2, 6, 2, 2.
- How many children are there in all?
- Counting all the children in all the families, how many children would use each computer? This is the number of children per computer. Call this number \(A\).
- Fill in the third column of the table. Decide how many computers to give to each family if we use \(A\) as the basis for distributing the computers.
family number of children number of computers, using \(A\) Baum 4 Chu 2 Davila 6 Eno 2 Farouz 2 -
Check that 8 computers have been given out in all.
-
The next month they again have 8 computers. There are different families with these numbers of children: 3, 1, 2, 5, 1, 8.
- How many children are there in all?
- Counting all the children in all the families, how many children would use each computer? This is the number of children per computer. Call this number \(B\).
- Does it make sense that \(B\) is not a whole number? Why?
- Fill in the third column of the table. Decide how many computers to give to each family if we use \(B\) as the basis for distributing the computers.
family number of children number of computers, using \(B\) number of computers, your way children per computer, your way Gray 3 Hernandez 1 Ito 2 Jones 5 Krantz 1 Lo 8 -
Check that 8 computers have been given out in all.
- Does it make sense that the number of computers for one family is not a whole number? Explain your reasoning.
- Find and describe a way to distribute computers to the families so that each family gets a whole number of computers. Fill in the fourth column of the table.
- Compute the number of children per computer in each family and fill in the last column of the table.
-
Do you think your way of distributing the computers is fair? Explain your reasoning.
Student Response
For access, consult one of our IM Certified Partners.
Anticipated Misconceptions
Division has two roles in this activity, as discussed in the unit on dividing fractions. Dividing 16 children by 8 computers is like putting 16 pounds of almonds into 8 bags, giving 2 pounds of almonds per bag. Bagging 6 pounds of almonds at 2 pounds of almonds per bag fills 3 bags.
Activity Synthesis
Invite students to share their answers.
For question 1, there should be an agreement that every two children share a computer.
For question 2, find students who chose different ways to distribute the computers.
Ask students which distribution they think is more fair and explain why. There may be no answer that everyone agrees on.
6.2: School Mascot (Part 1) (15 minutes)
Activity
This lesson explores mathematical difficulties that arise in a representative democracy, where people do not vote individually, but vote for representatives who vote for all their constituents. This is in part a sharing problem. If all the people in a town are to be represented by a few people, the representatives should be shared as equally as possible. However, sometimes the groups to be represented are predetermined, such as classrooms or states. It’s not always possible to have the same numbers of constituents per representative. This part of the activity is mathematically the same as sharing computers among families, as in the previous activity.
A further difficulty is that different people in the same group will usually have different opinions. The representative has only one vote, so it’s impossible to fairly represent the opinions of all the constituents.
The mathematical issues involve unit rates and division, usually resulting in decimals.
This activity uses a voting situation with one vote per class. Similarly to the families with computers, three classrooms need to share three votes. The vote for the class is whichever choice wins a majority in the class election. Students discover that this system is unfair, since a class voting heavily for one choice counts for the same as a class barely voting for the choice (“yessiness”). They use division to try to devise a more fair system. Monitor for different ways to assign votes.
Note: a banana slug is a bright yellow snail without a shell that lives in redwood forests. Students at the University of California Santa Cruz voted for the banana slug as their mascot; the administration thought sea lions were more dignified.
Launch
Arrange students in groups of 2. Students start with 5 minutes quiet think time, followed by comparing work with a partner. Provide access to four-function calculators.
Supports accessibility for: Memory; Conceptual processing
Student Facing
A school is deciding on a school mascot. They have narrowed the choices down to the Banana Slugs or the Sea Lions.
The principal decided that each class gets one vote. Each class held an election, and the winning choice was the one vote for the whole class. The table shows how three classes voted.
| banana slugs | sea lions | class vote | |
|---|---|---|---|
| class A | 9 | 3 | banana slug |
| class B | 14 | 10 | |
| class C | 6 | 30 |

- Which mascot won, according to the principal’s plan? What percentage of the votes did the winner get under this plan?
- Which mascot received the most student votes in all? What percentage of the votes did this mascot receive?
- The students thought this plan was not very fair. They suggested that bigger classes should have more votes to send to the principal. Make up a proposal for the principal where there are as few votes as possible, but the votes proportionally represent the number of students in each class.
- Decide how to assign the votes for the results in the class. (Do they all go to the winner? Or should the loser still get some votes?)
-
In your system, which mascot is the winner?
-
In your system, how many representative votes are there? How many students does each vote represent?
Student Response
For access, consult one of our IM Certified Partners.
Anticipated Misconceptions
Students may be confused about the two-step process: each class votes, then the representative votes for the winner of the class vote. There are only three people voting at the second (representative) level. If necessary, act out the vote by dividing the class into three groups, not necessarily equal, and appointing a representative for each.
Students may object that this system is not fair. They are right: there is the potential for a minority choice to win the election.
Activity Synthesis
Invite students to share their ways to assign votes and the reasons for their system. Select students who have different methods.
Students should recognize, after discussion, that the system the principal proposed is unfair. A majority in a small class voting for banana slugs can overwhelm a larger number voting for sea lions in a larger class.
A more fair system should take the sizes of the classes into account.
6.3: Advising the School Board (30 minutes)
Activity
This activity includes two problems of assigning representatives proportionally, with schools sending students to advise the school board. In the first problem, school sizes have been carefully planned so that each school has the same number of students per representative as the district as a whole. In the second, this is not possible, in part because of a very large and a very small school.
The mathematics includes finding rates by division, quotients and divisors that are decimals, and rounding, as well as quantitative reasoning (MP2).
The mathematics is the same as the previous activity distributing computers to families. It is also the same as the problem of assigning congressional representatives to states. Some states have very large populations, and others have very small populations.
As students work, monitor for different ways that they assign advisors.
Launch
Arrange students in groups of 2–4. Provide access to four-function calculators if desired.
Explain the situation: “The school board (the elected people who make major decisions about all the schools) wants students from the schools to help them decide, and to give the board advice about what the students at each school think. They would like 10 students to be chosen to come to school board meetings. These students will be called advisors. Big schools should send more advisors than small schools, but even the tiniest school should send at least one advisor. If possible, the number of advisors should be proportional to the number of students at the school.”
Supports accessibility for: Organization; Attention
Design Principle(s): Support sense-making; Maximize meta-awareness
Student Facing
- In a very small school district, there are four schools, D, E, F, and G. The district wants a total of 10 advisors for the students. Each school should have at least one advisor.
school number of students number of advisors, using \(A\) D 48 E 12 F 24 G 36 - How many students are in this district in all?
- If the advisors could represent students at different schools, how many students per advisor should there be? Call this number \(A\).
- Using \(A\) students per advisor, how many advisors should each school have? Complete the table with this information for schools D, E, F, and G.
- Another district has four schools; some are large, others are small. The district wants 10 advisors in all. Each school should have at least one advisor.
school number of students number of advisors,
using \(B\)number of advisors,
your waystudents per advisor,
your wayDr. King School 500 O’Connor School 200 Science Magnet School 140 Trombone Academy 10 - How many students are in this district in all?
- If the advisors didn’t have to represent students at the same school, how many students per advisor should there be? Call this number \(B\).
- Using \(B\) students per advisor, how many advisors should each school have? Give your quotients to the tenths place. Fill in the first “number of advisors” column of the table. Does it make sense to have a tenth of an advisor?
- Decide on a consistent way to assign advisors to schools so that there are only whole numbers of advisors for each school, and there is a total of 10 advisors among the schools. Fill in the “your way” column of the table.
- How many students per advisor are there at each school? Fill in the last row of the table.
- Do you think this is a fair way to assign advisors? Explain your reasoning.
Student Response
For access, consult one of our IM Certified Partners.
Activity Synthesis
Invite several students to present their work, especially their attempts to assign advisors fairly. Choose students who chose different ways to assign advisors.
The ideal number of students per representative is 85, an average. King School is very close to this ideal. The other schools have much higher or lower numbers.
The big idea here is that it’s impossible to be completely fair. The Trombone Academy will have more clout than the bigger schools because their advisor is representing only 10 students. On the other hand, if the Trombone Academy gets no advisors, then their views aren’t represented at all, so this isn’t fair either.
6.4: School Mascot (Part 2) (10 minutes)
Activity
In the previous activities, representatives (“advisors”) were assigned to groups that couldn’t be changed: schools. Sometimes the groups or districts for representatives can be changed, as in districts for the U.S. House of Representatives, and for state legislatures, wards in cities, and so on. Often, the people in an area have similar opinions, so it’s possible to design districts where you can reliably predict the outcomes.
In this lesson, students use geometric reasoning about areas and connectedness to experiment with drawing districts in a way that predict the outcome of elections. This is often called gerrymandering.
Launch
Arrange students in groups of 2–4.
Supports accessibility for: Visual-spatial processing; Conceptual processing
Student Facing
The whole town gets interested in choosing a mascot. The mayor of the town decides to choose representatives to vote.
There are 50 blocks in the town, and the people on each block tend to have the same opinion about which mascot is best. Green blocks like sea lions, and gold blocks like banana slugs. The mayor decides to have 5 representatives, each representing a district of 10 blocks.
Here is a map of the town, with preferences shown.

- Suppose there were an election with each block getting one vote. How many votes would be for banana slugs? For sea lions? What percentage of the vote would be for banana slugs?
-
Suppose the districts are shown in the next map. What did the people in each district prefer? What did their representative vote? Which mascot would win the election?
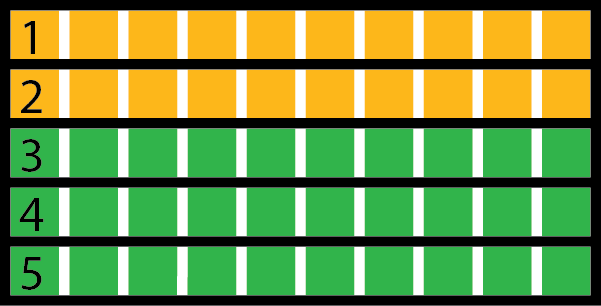
Complete the table with this election’s results.
district number of
blocks for
banana slugsnumber of
blocks for
sea lionspercentage of
blocks for
banana slugsrepresentative’s
vote1 10 0 banana slugs 2 3 4 5 -
Suppose, instead, that the districts are shown in the new map below. What did the people in each district prefer? What did their representative vote? Which mascot would win the election?
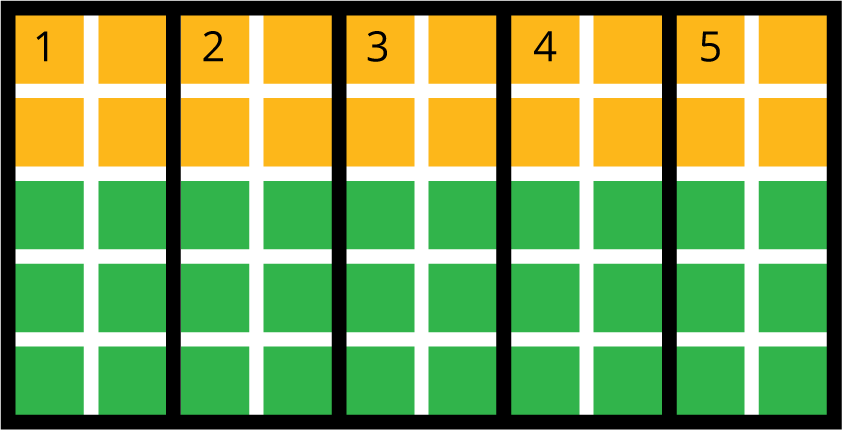
Complete the table with this election’s results.
district number of
blocks for
banana slugsnumber of
blocks for
sea lionspercentage of
blocks for
banana slugsrepresentative’s
vote1 2 3 4 5 -
Suppose the districts are designed in yet another way, as shown in the next map. What did the people in each district prefer? What did their representative vote? Which mascot would win the election?
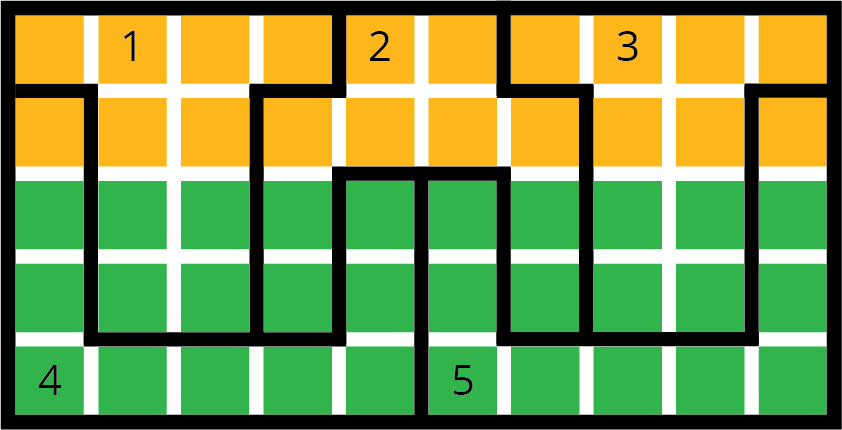
Complete the table with this election’s results.
district number of
blocks for
banana slugsnumber of
blocks for
sea lionspercentage of
blocks for
banana slugsrepresentative’s
vote1 2 3 4 5 -
Write a headline for the local newspaper for each of the ways of splitting the town into districts.
-
Which systems on the three maps of districts do you think are more fair? Are any totally unfair?
Student Response
For access, consult one of our IM Certified Partners.
Activity Synthesis
Ask students to share some of their headlines. Discuss the fairness of the different district arrangements.
Design Principle(s): Optimize output (for explanation); Cultivate conversation; Maximize meta-awareness
6.5: Fair and Unfair Districts (30 minutes)
Activity
Students design districts in three towns to “gerrymander” the results of elections. In two of the towns, the election results can be skewed to either color. In the third, it isn’t possible to skew the results.
Launch
Arrange students in groups of 2–4.
Explain the history of gerrymandering: Sometimes people in charge of designing districts make them in strange shapes to give the election results they want. One of the first was Elbridge Gerry (governor of Massachusetts in 1812), whose party designed a district that many people thought looked like a salamander. They called a Gerrymander, and the name stuck. It means a very strangely shaped, spread-out district designed to produce a certain result.
Usually districts are required to be connected: a person traveling to all parts of the district should be able to stay inside the district. There should be no “islands” that are separated by parts of other districts.
Supports accessibility for: Organization; Attention
Student Facing
-
Smallville’s map is shown, with opinions shown by block in green and gold. Decompose the map to create three connected, equal-area districts in two ways:
-
Design three districts where green will win at least two of the three districts. Record results in Table 1.

Table 1:
district number of blocks
for greennumber of blocks
for goldpercentage
of blocks
for greenrepresentative’s
vote1 2 3 -
Design three districts where gold will win at least two of the three districts. Record results in Table 2.

Table 2:
district number of blocks
for greennumber of blocks
for goldpercentage
of blocks
for greenrepresentative’s
vote1 2 3
-
-
Squaretown’s map is shown, with opinions by block shown in green and gold. Decompose the map to create five connected, equal-area districts in two ways:
- Design five districts where green will win at least three of the five districts. Record the results in Table 3.

Table 3:
district number of blocks
for greennumber of blocks
for goldpercentage
of blocks
for greenrepresentative’s
vote1 2 3 4 5 - Design five districts where gold will win at least three of the five districts. Record the results in Table 4.

Table 4:
district number of blocks
for greennumber of blocks
for goldpercentage
of blocks
for greenrepresentative’s
vote1 2 3 4 5 - Design five districts where green will win at least three of the five districts. Record the results in Table 3.
-
Mountain Valley’s map is shown, with opinions by block shown in green and gold. (This is a town in a narrow valley in the mountains.) Can you decompose the map to create three connected, equal-area districts in the two ways described here?
-
Design three districts where green will win at least 2 of the 3 districts. Record the results in Table 5.

Table 5:
district number of blocks
for greennumber of blocks
for goldpercentage
of blocks
for greenrepresentative’s
vote1 2 3 -
Design three districts where gold will win at least 2 of the 3 districts. Record the results in Table 6.

Table 6:
district number of blocks
for greennumber of blocks
for goldpercentage
of blocks
for greenrepresentative’s
vote1 2 3
-
Student Response
For access, consult one of our IM Certified Partners.
Anticipated Misconceptions
The white streets on the maps do not disconnect the districts.
However, probably squares that are only connected at their corners should not be considered connected to each other. (But you or the students can make their own rule, since they are in charge of making districts.)
Activity Synthesis
This set of questions is similar to the previous activity, except that the patterns are irregular, so more planning and computation is needed to design districts.
Ask several students with different maps to show and explain their work.
The important result for this problem is that it’s possible to design both fair districts (where the result of the vote is similar to the vote if all individual votes were counted) and unfair districts. According to the rules (equal area and connected), these sets of districts are legal. Encourage students to try to devise some rules for drawing districts that would be more fair.