Lesson 5
How Crowded Is this Neighborhood?
Let’s see how proportional relationships apply to where people live.
5.1: Dot Density
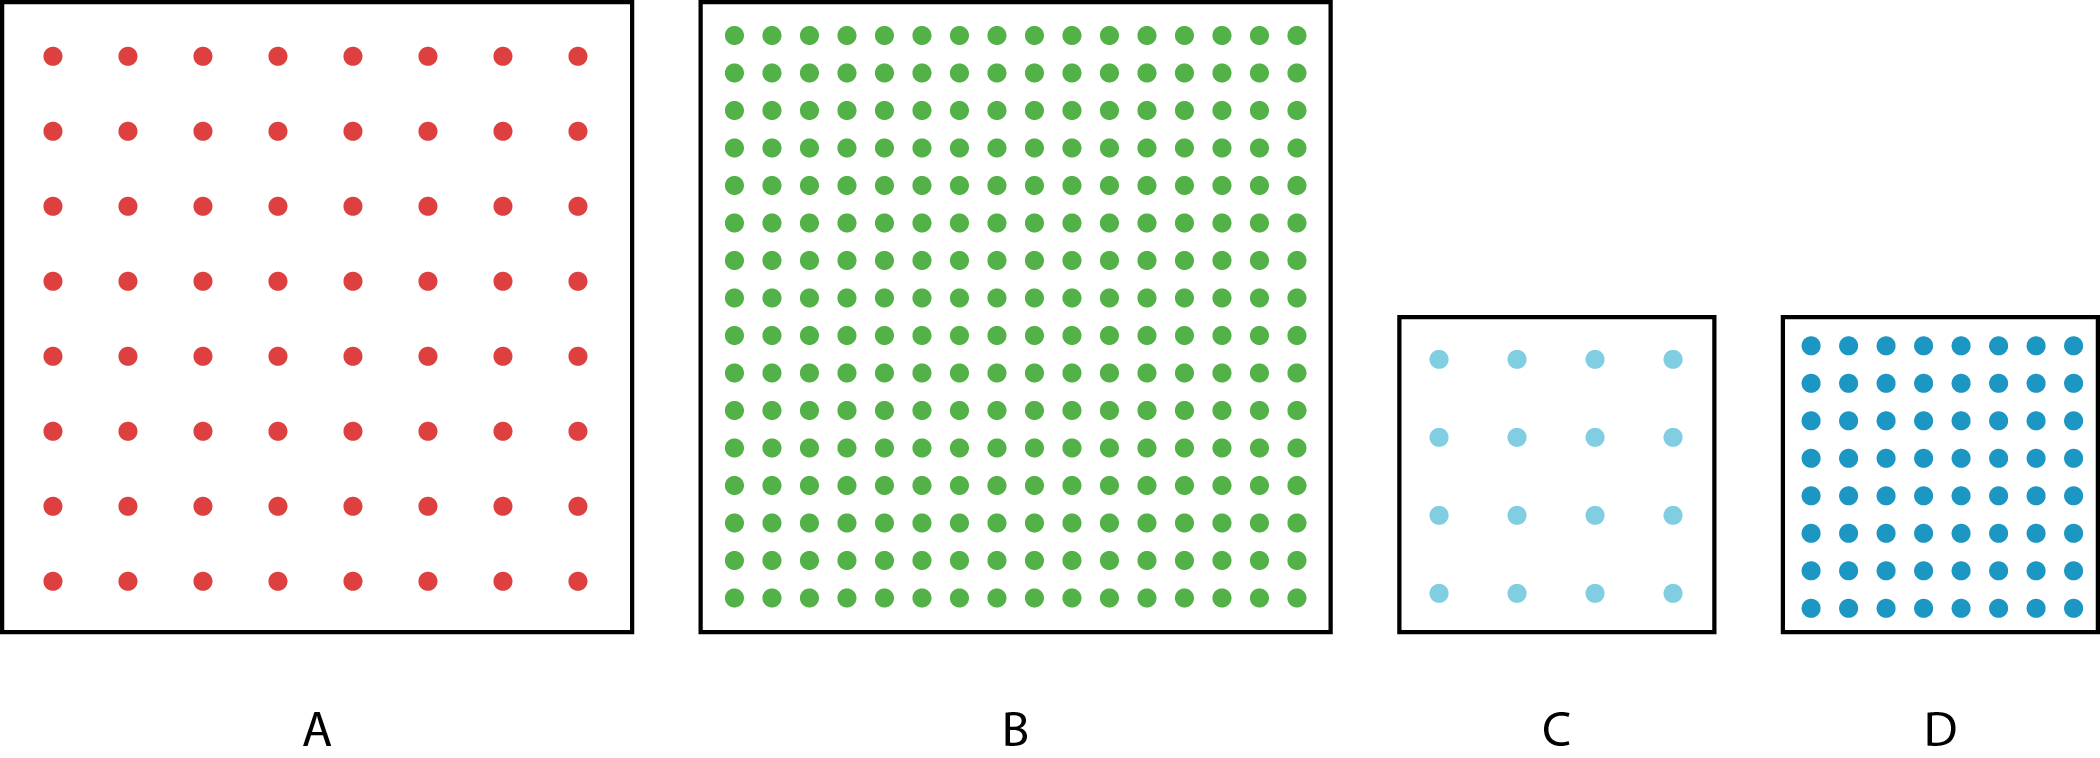
The figure shows four squares. Each square encloses an array of dots. Squares A and B have side length 2 inches. Squares C and D have side length 1 inch.
-
Complete the table with information about each square.
square area of the square
in square inchesnumber
of dotsnumber of dots
per square inchA B C D -
Compare each square to the others. What is the same and what is different?
5.2: Dot Density with a Twist
The figure shows two arrays, each enclosed by a square that is 2 inches wide.

- Let \(a\) be the area of the square and \(d\) be the number of dots enclosed by the square. For each square, plot a point that represents its values of \(a\) and \(d\). Start by choosing an appropriate scale for each axis, using the sliders to adjust the intervals.
-
Draw lines from \((0, 0)\) to each point. For each line, write an equation that represents the proportional relationship.
-
What is the constant of proportionality for each relationship? What do the constants of proportionality tell us about the dots and squares?
5.3: Housing Density
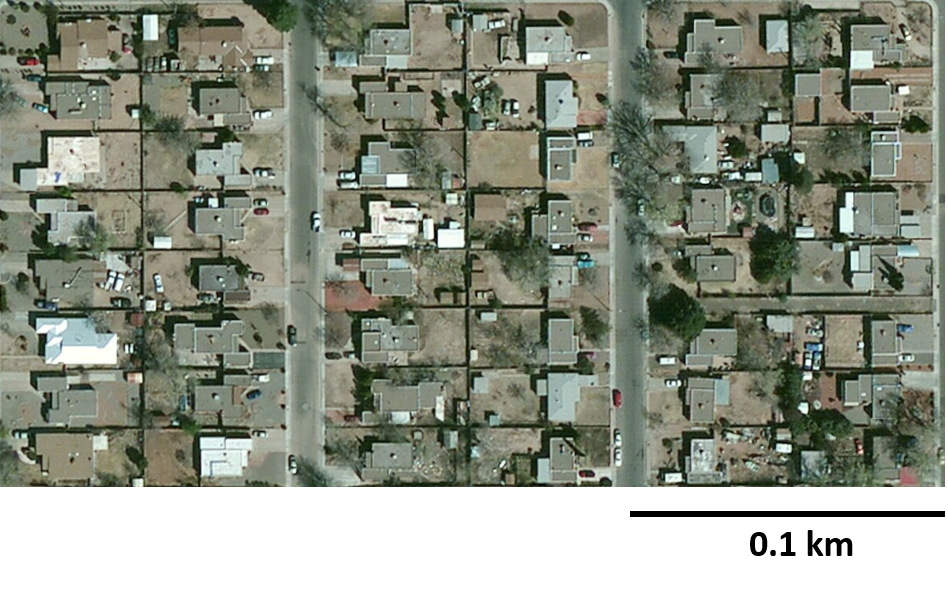
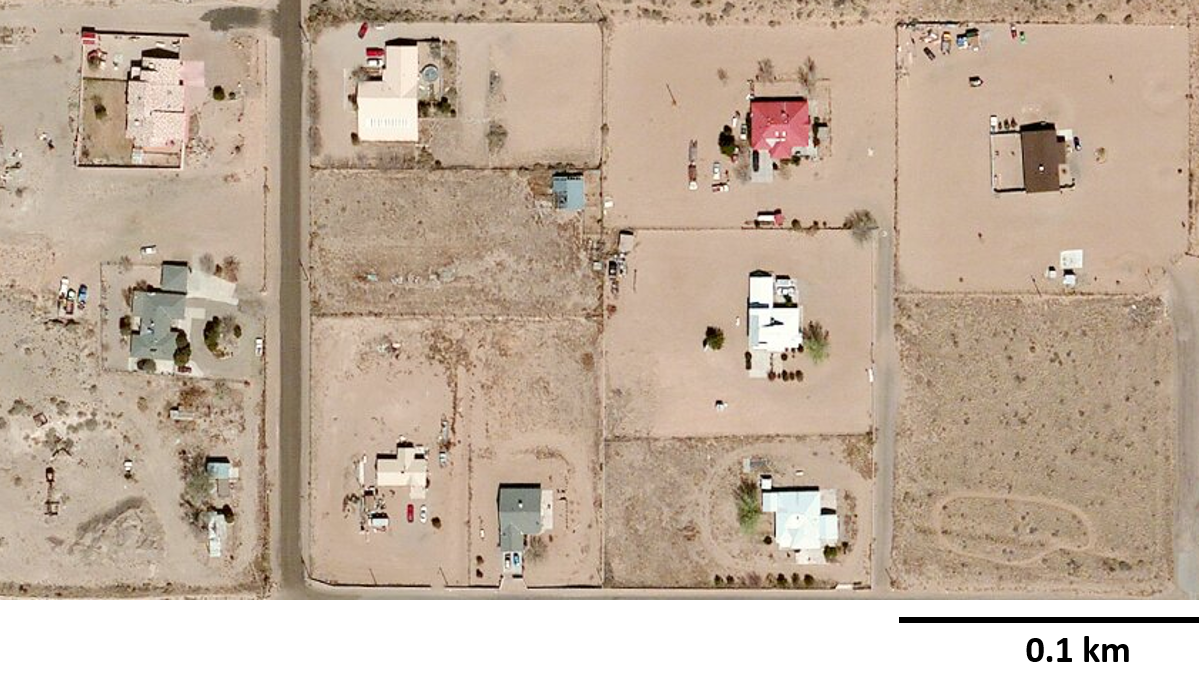
Here are pictures of two different neighborhoods.
This image depicts an area that is 0.3 kilometers long and 0.2 kilometers wide.
This image depicts an area that is 0.4 kilometers long and 0.2 kilometers wide.
5.4: Population Density
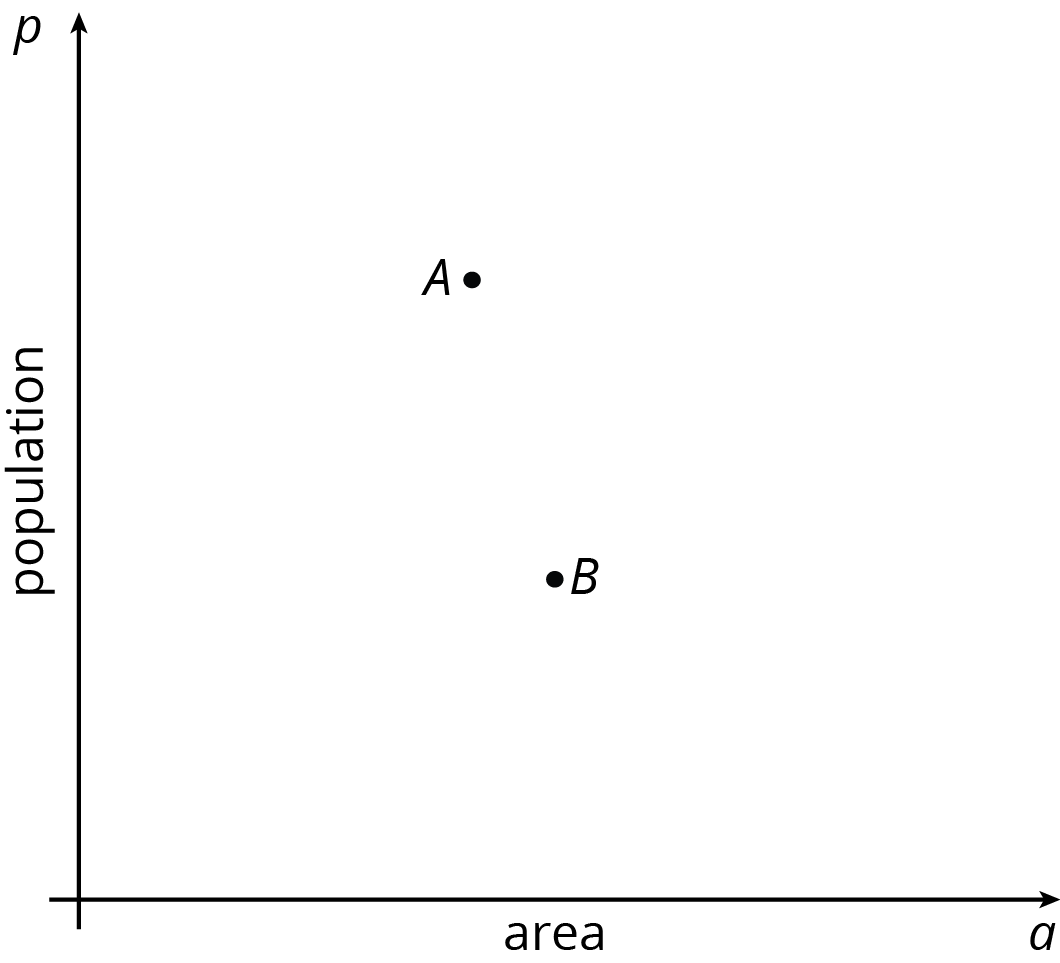
- New York City has a population of 8,406 thousand people and covers an area of 1,214 square kilometers.
- Los Angeles has a population of 3,884 thousand people and covers an area of 1,302 square kilometers.
-
The points labeled \(A\) and \(B\) each correspond to one of the two cities. Which is which? Label them on the graph.
-
Write an equation for the line that passes through \((0, 0)\) and \(A\). What is the constant of proportionality?
-
Write an equation for the line that passes through \((0, 0)\) and \(B\). What is the constant of proportionality?
- What do the constants of proportionality tell you about the crowdedness of these two cities?
-
Predict where these types of regions would be shown on the graph:
-
a suburban region where houses are far apart, with big yards
-
a neighborhood in an urban area with many high-rise apartment buildings
-
a rural state with lots of open land and not many people
-
-
Next, use this data to check your predictions:
place description population area (km2) Chalco a suburb of Omaha, Nebraska 10,994 7.5 Anoka County a county in Minnesota, near Minneapolis/St. Paul 339,534 1,155 Guttenberg a city in New Jersey 11,176 0.49 New York a state 19,746,227 141,300 Rhode Island a state 1,055,173 3,140 Alaska a state 736,732 1,717,856 Tok a community in Alaska 1,258 342.7